Gold Price Forecast: XAU/USD refreshes 11-month high near $1,990 as signs of steady flat policy soar
- Gold price has printed a fresh 11-month high at $1,988.33 as it is being treated as a safe-haven amid the banking fiasco.
- Fed policymakers are tied to go extremely hawkish as they are required to restore investors’ confidence.
- Gold price is further approaching the horizontal resistance plotted around $2,070.54.
Gold price (XAU/USD) printed a fresh 11-month high at $1,988.33 on Friday. The precious metal is approaching the psychological resistance of $2,000.00 and is expected to test soon as the odds of an unchanged interest rate policy by the Federal Reserve (Fed) have accelerated dramatically.
The odds of a steady monetary policy have got more limelight as January’s inflation data has resulted in a one-time blip, February’s Consumer Price Index (CPI) has shown that it is in a declining trend, and now Fed policymakers have a responsibility of restoring investors’ confidence in the United States economy after the commercial banks’ fiasco.
As per the CME Fedwatch tool, investors are now expecting the possibility of an unchanged monetary policy with 38% chances while the rest are favoring a 25 basis point (bps) interest rate hike by Fed chair Jerome Powell to 4.75-5.00%.
S&P500 futures were heavily beaten on Friday as investors are worried about banking sector turmoil. In times of banking shakedown, investors are considering Gold as a safe-haven asset. The US Dollar Index (DXY) found intermediate support around 103.65, however further downside looks solid as Fed policymakers are tied to go extremely hawkish in the interest rate decision to be delivered on Wednesday.
In a recent poll by Reuters, 76 of 82 economists believe that the US Federal Reserve (Fed) would raise its policy rate by 25 basis points to the range of 4.75-5% following the March FOMC meeting
Gold technical analysis
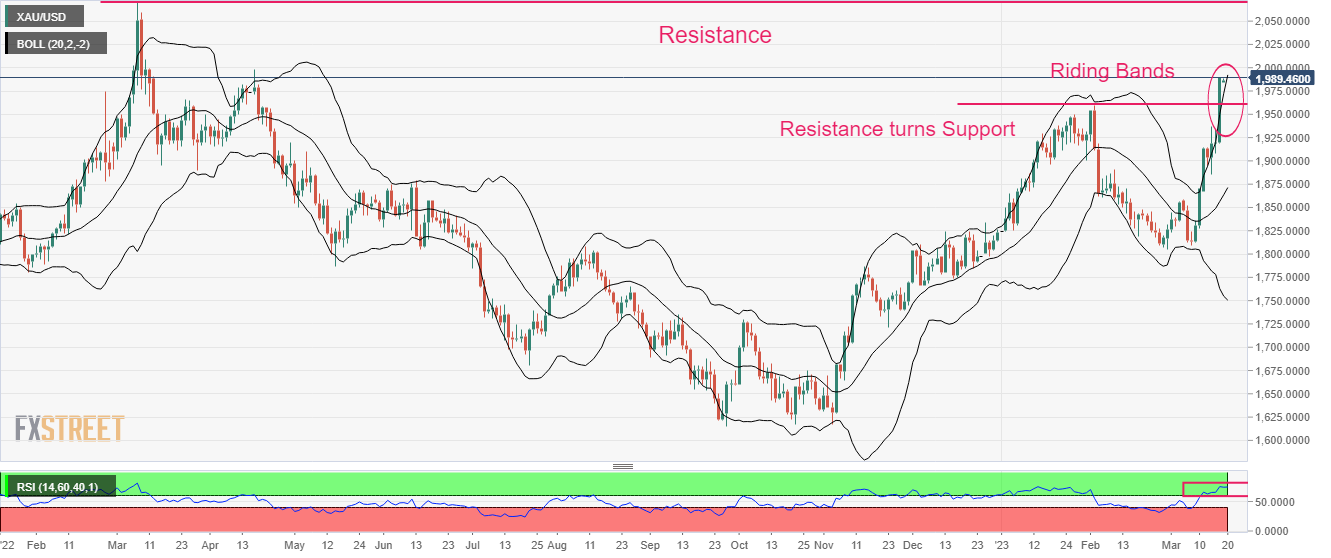
Gold price has delivered a breakout of the horizontal resistance plotted from the February 02 high at $1,959.80, which has turned support on a daily scale. The asset is riding the Bollinger Bands (20,2), which indicates a sheer strength in the Gold bulls.
The precious metal is further approaching the horizontal resistance plotted from the 08 March 2022 high at $2,070.54.
Meanwhile, the Relative Strength Index (RSI) (14) is oscillating in the bullish range of 60.00-80.00, which indicates that the upside momentum is extremely solid.
Gold daily scale