Gold Price Forecast: XAU/USD extends recovery above $1,990 as Fed to sound neutral on interest rate guidance
- Gold price has managed to surpass $1,990.00 after a recovery move as investors anticipate neutral guidance from Fed.
- Market mood is upbeat as investors digested fears of recession and shifted focus to outperformance from US tech stocks.
- Gold price is inside the woods for the past week in a range of $1,974.08-2,014.22, indicating a volatility contraction.
Gold price (XAU/USD) has climbed above $1,990.00 after rebounding from $1,976.00 in the Asian session. The precious metal witnessed a steep fall on Thursday after House Speaker McCarthy said the debt limit can't pass without dealing with the budget, as reported by Bloomberg.
Investors were expecting that increase in the US debt ceiling could impact the long-term rating of the United States economy, which would impact the US Dollar but will improve the appeal of the Gold price as a safe-haven. A delay in US debt-ceiling talks weighed heavily on the Gold price.
S&P500 futures are showing nominal losses in the Asian session. The 500-US stocks basket was heavily bought on Thursday as investors digested fears of recession due to higher interest rates from the Federal Reserve (Fed) and shifted focus to outperformance quarterly performance from US tech-savvy stocks. The risk profile is mildly cautious amid an overall cheerful mood.
The US Dollar Index (DXY) has rebounded after defending the critical support of 101.00 despite higher chances that one more rate hike from the Federal Reserve (Fed) could be the last nail in the coffin. A consecutive 25 basis point (bp) interest rate hike from the Fed would push rates above 5%. Apart from that, neutral interest rate guidance is expected from Fed chair Jerome Powell as firms are losing confidence due to higher borrowing costs and inflation is softening consistently.
Gold technical analysis
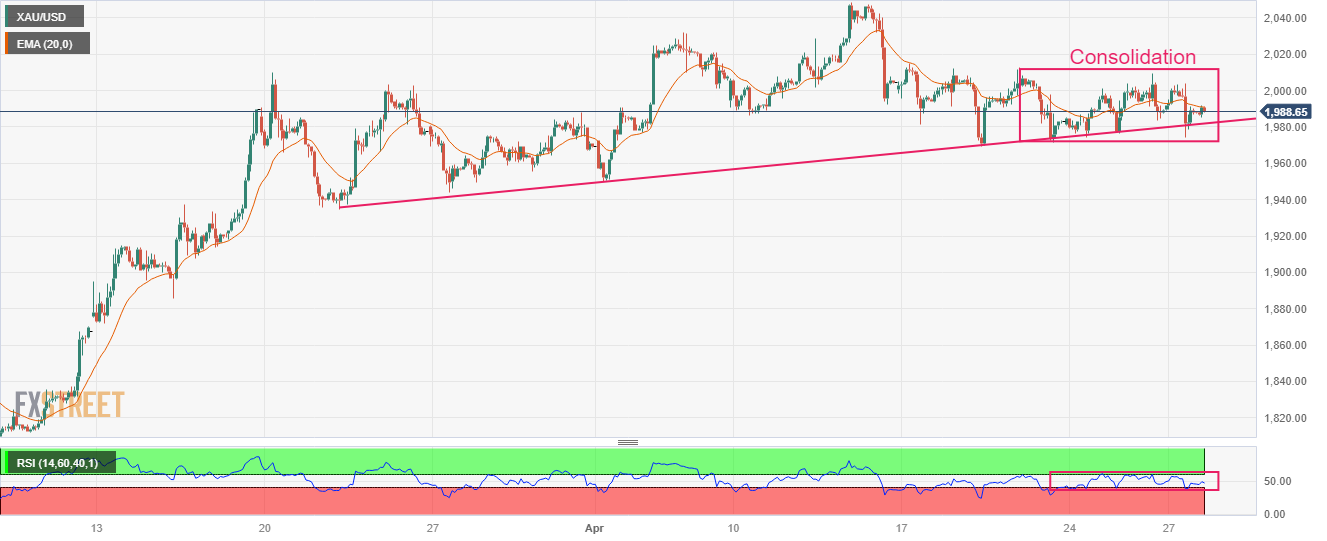
Gold price is inside the woods from the past week in a range of $1,974.08-2,014.22 on a two-hour scale. Lengthy consolidation indicates a sheer volatility contraction, which is expected to be followed by wider ticks and heavy volume after an explosion.
Advancing trendline from March 22 low at $1,934.34 is acting as a cushion for the Gold bulls.
The 20-period Exponential Moving Average (EMA) at $1,988.82 is continuously hovering around the Gold price, hinting at a sideways performance.
Also, the Relative Strength Index (RSI) (14) is oscillating in the 40.00-60.00 range, indicating an absence of a critical trigger.
Gold two-hour chart