USD/CAD Price Analysis: Consolidates around 1.3650 within a horizontal channel
- USD/CAD move sideways within a horizontal channel pattern.
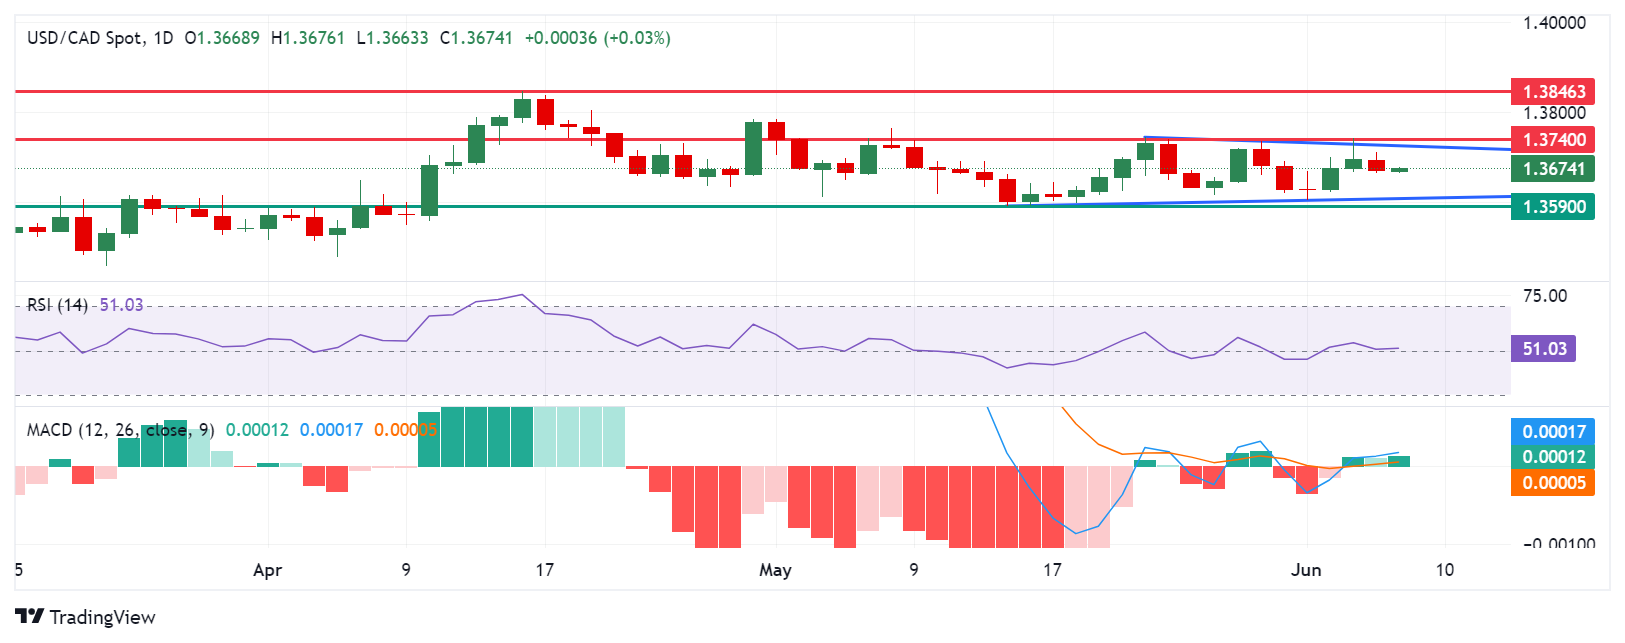
- The technical indicator MACD suggests an emergence of a bullish bias.
- The psychological level of 1.3700 appears as the key resistance level.
USD/CAD retraces its recent losses, trading around 1.3670 during the early European hours on Friday. Analysis of the daily chart suggests a sideways direction for the USD/CAD pair, as it remains within a horizontal channel pattern.
However, the momentum indicator 14-day Relative Strength Index (RSI) is positioned at the 50 level, and further movement may indicate a clear direction.
Additionally, the Moving Average Convergence Divergence (MACD) indicator suggests an emergence of the bullish bias for the USD/CAD pair. While the MACD line is positioned above the centerline, it shows divergence above the signal line.
On the upside, the USD/CAD pair could find the key barrier at the psychological level of 1.3700. A breakthrough above this level could provide support for the pair to test the upper boundary of the horizontal channel around the level of 1.3720, followed by the pullback resistance at 1.3740.
A surpassing of the latter could lead the USD/CAD pair to explore the region around the key level of 1.3800, followed by April’s high of 1.3846.
On the downside, the USD/CAD pair could find key support around the lower threshold of the horizontal channel around the psychological level of 1.3600, aligned with the throwback support at 1.3590.
USD/CAD: Daily Chart