EUR/JPY Price Forecast: Long-term uptrend might still be intact
- EUR/JPY has been in an uptrend for over two years and despite a breakdown in July it may still be intact.
- Ideally, another break below the August lows in the 154s would be necessary to indicate a reversal of the trend.
EUR/JPY broke out of the rising channel it had been in for over two years, in late July.
The breakdown was a significant bearish sign; it was steeper than the prior uptrend indicating a possible reversal in the long-term trend.
Despite this, there is still not enough evidence to confirm a reversal lower and price could still recover and go back up again, resuming its broad uptrend.
EUR/JPY Weekly Chart
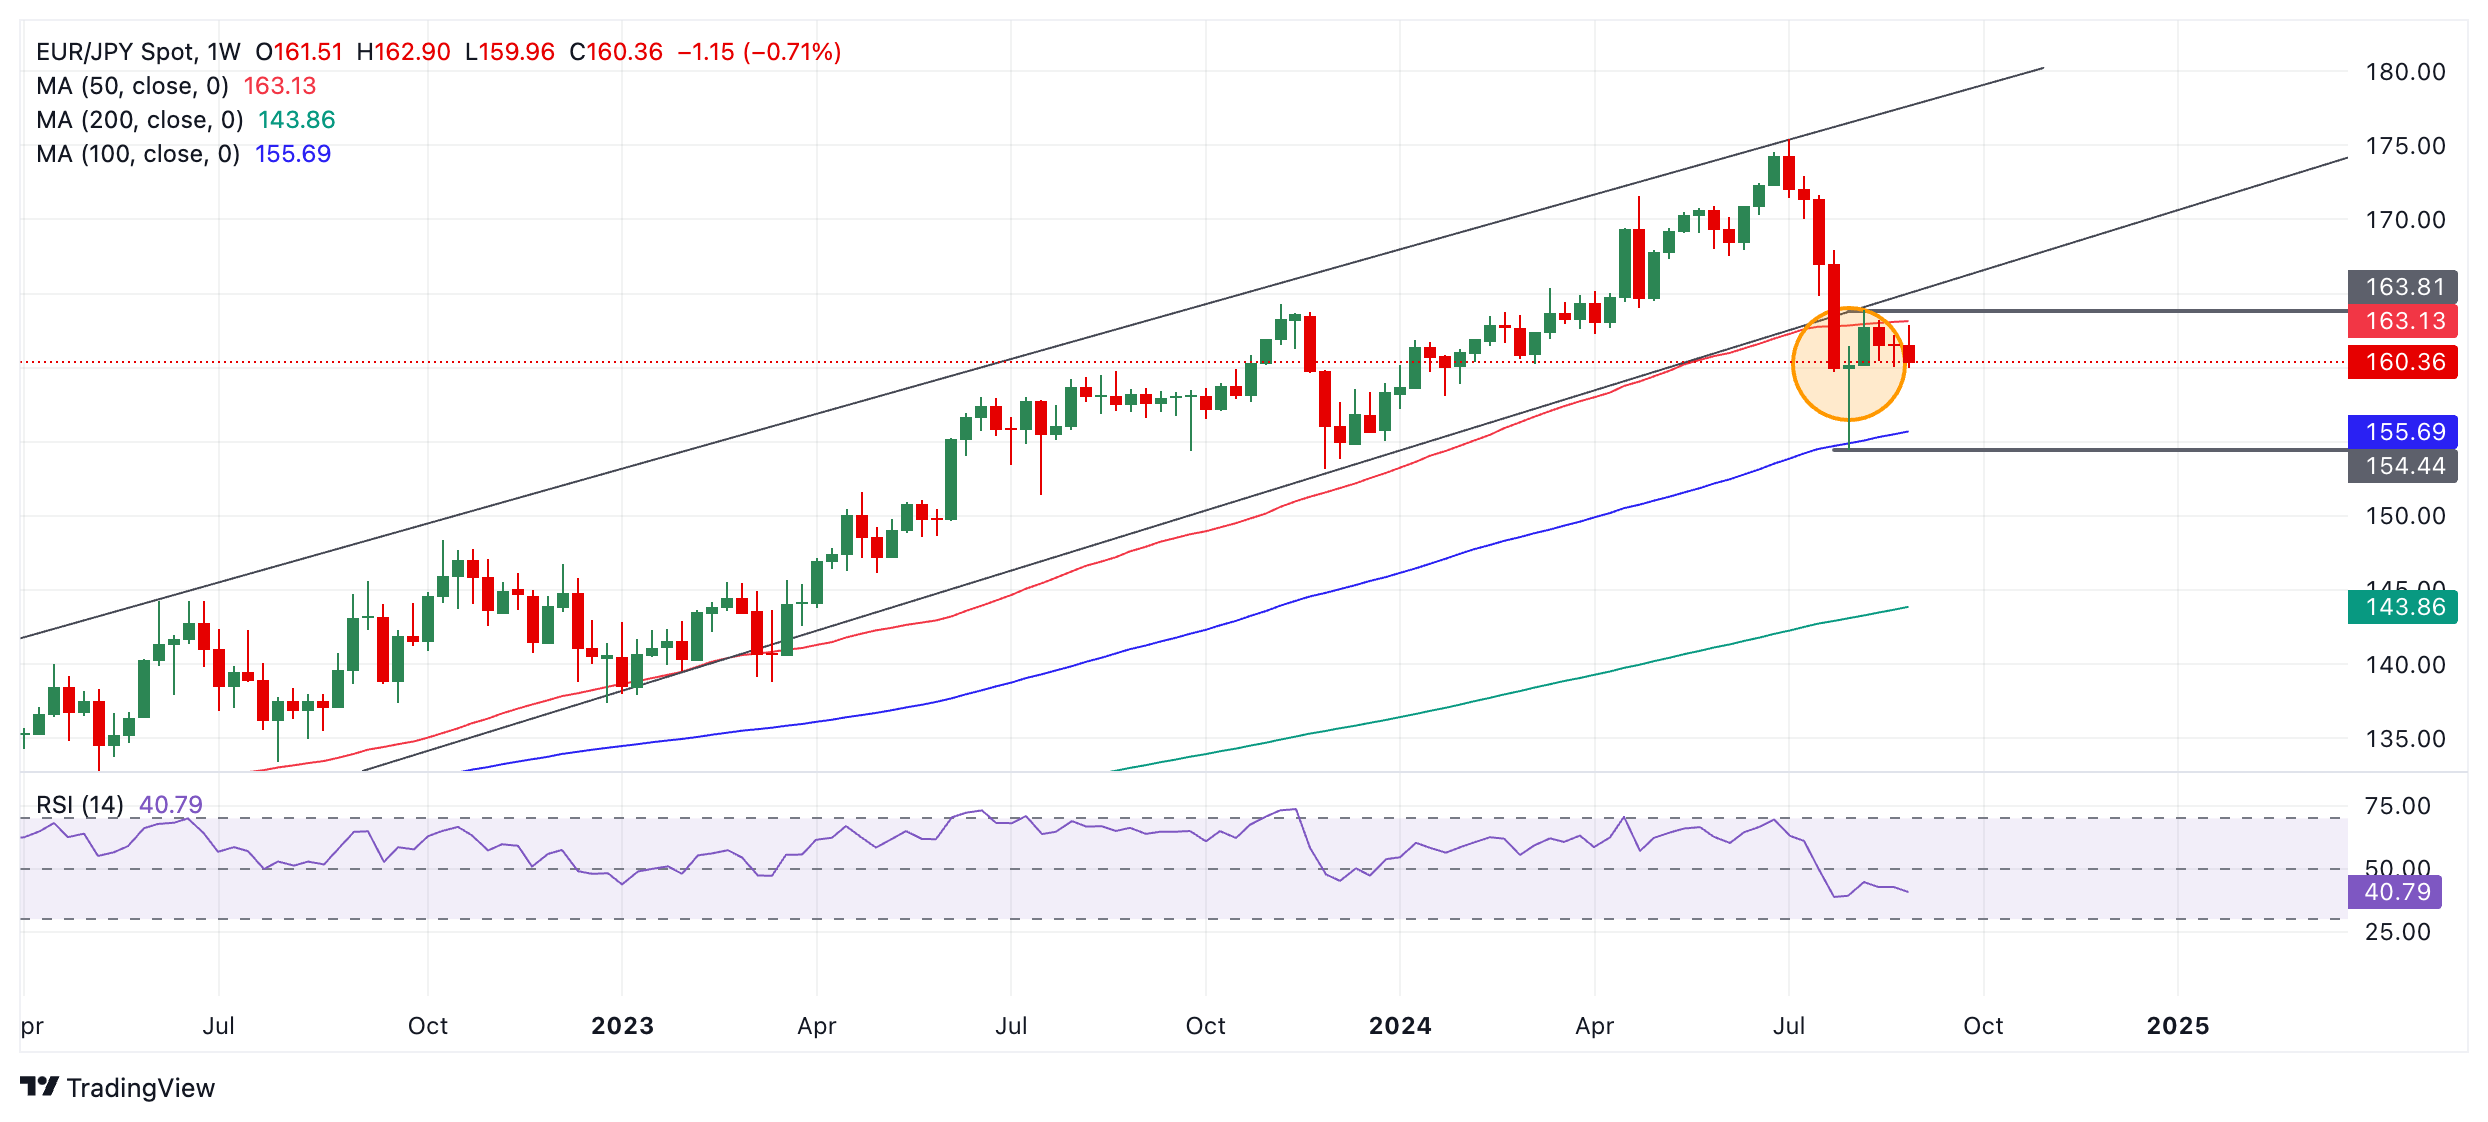
The sell-off from the peak in the 170s bottomed in the 154s at the level of the blue 100-week Simple Moving Average (SMA), a significant major SMA.
EUR/JPY then recovered, rising back above the 160 level during the beginning of August. The week-ending August 9 formed a bullish Dragonfly Doji Japanese candlestick pattern (shaded circle) which gained confirmation after the following week also closed green. Since then, however, price has broadly oscillated in a range.
A break above 163.89 would probably signal a resumption of the dominant multi-year uptrend. From there price would probably rise back up to the 50-day SMA at 166.00 (not shown), initially.
It would take a break below the low of the Dragonfly Doji at 154.41 to signal probable reversal of the longer-term trend. Such a move would probably find support at 151.41 at first – the late July lows.