USD/CHF Price Prediction: Bearish evidence builds for technical reversal
- USD/CHF is showing increasing evidence it might be reversing trend.
- It has formed a bearish Two-Bar reversal pattern and has broken the uptrend’s trendline three times.
USD/CHF looks like it is reversing the uptrend of the last five weeks. The technical evidence is building for the case the pair is beginning a new short-term downtrend.
USD/CHF Daily Chart
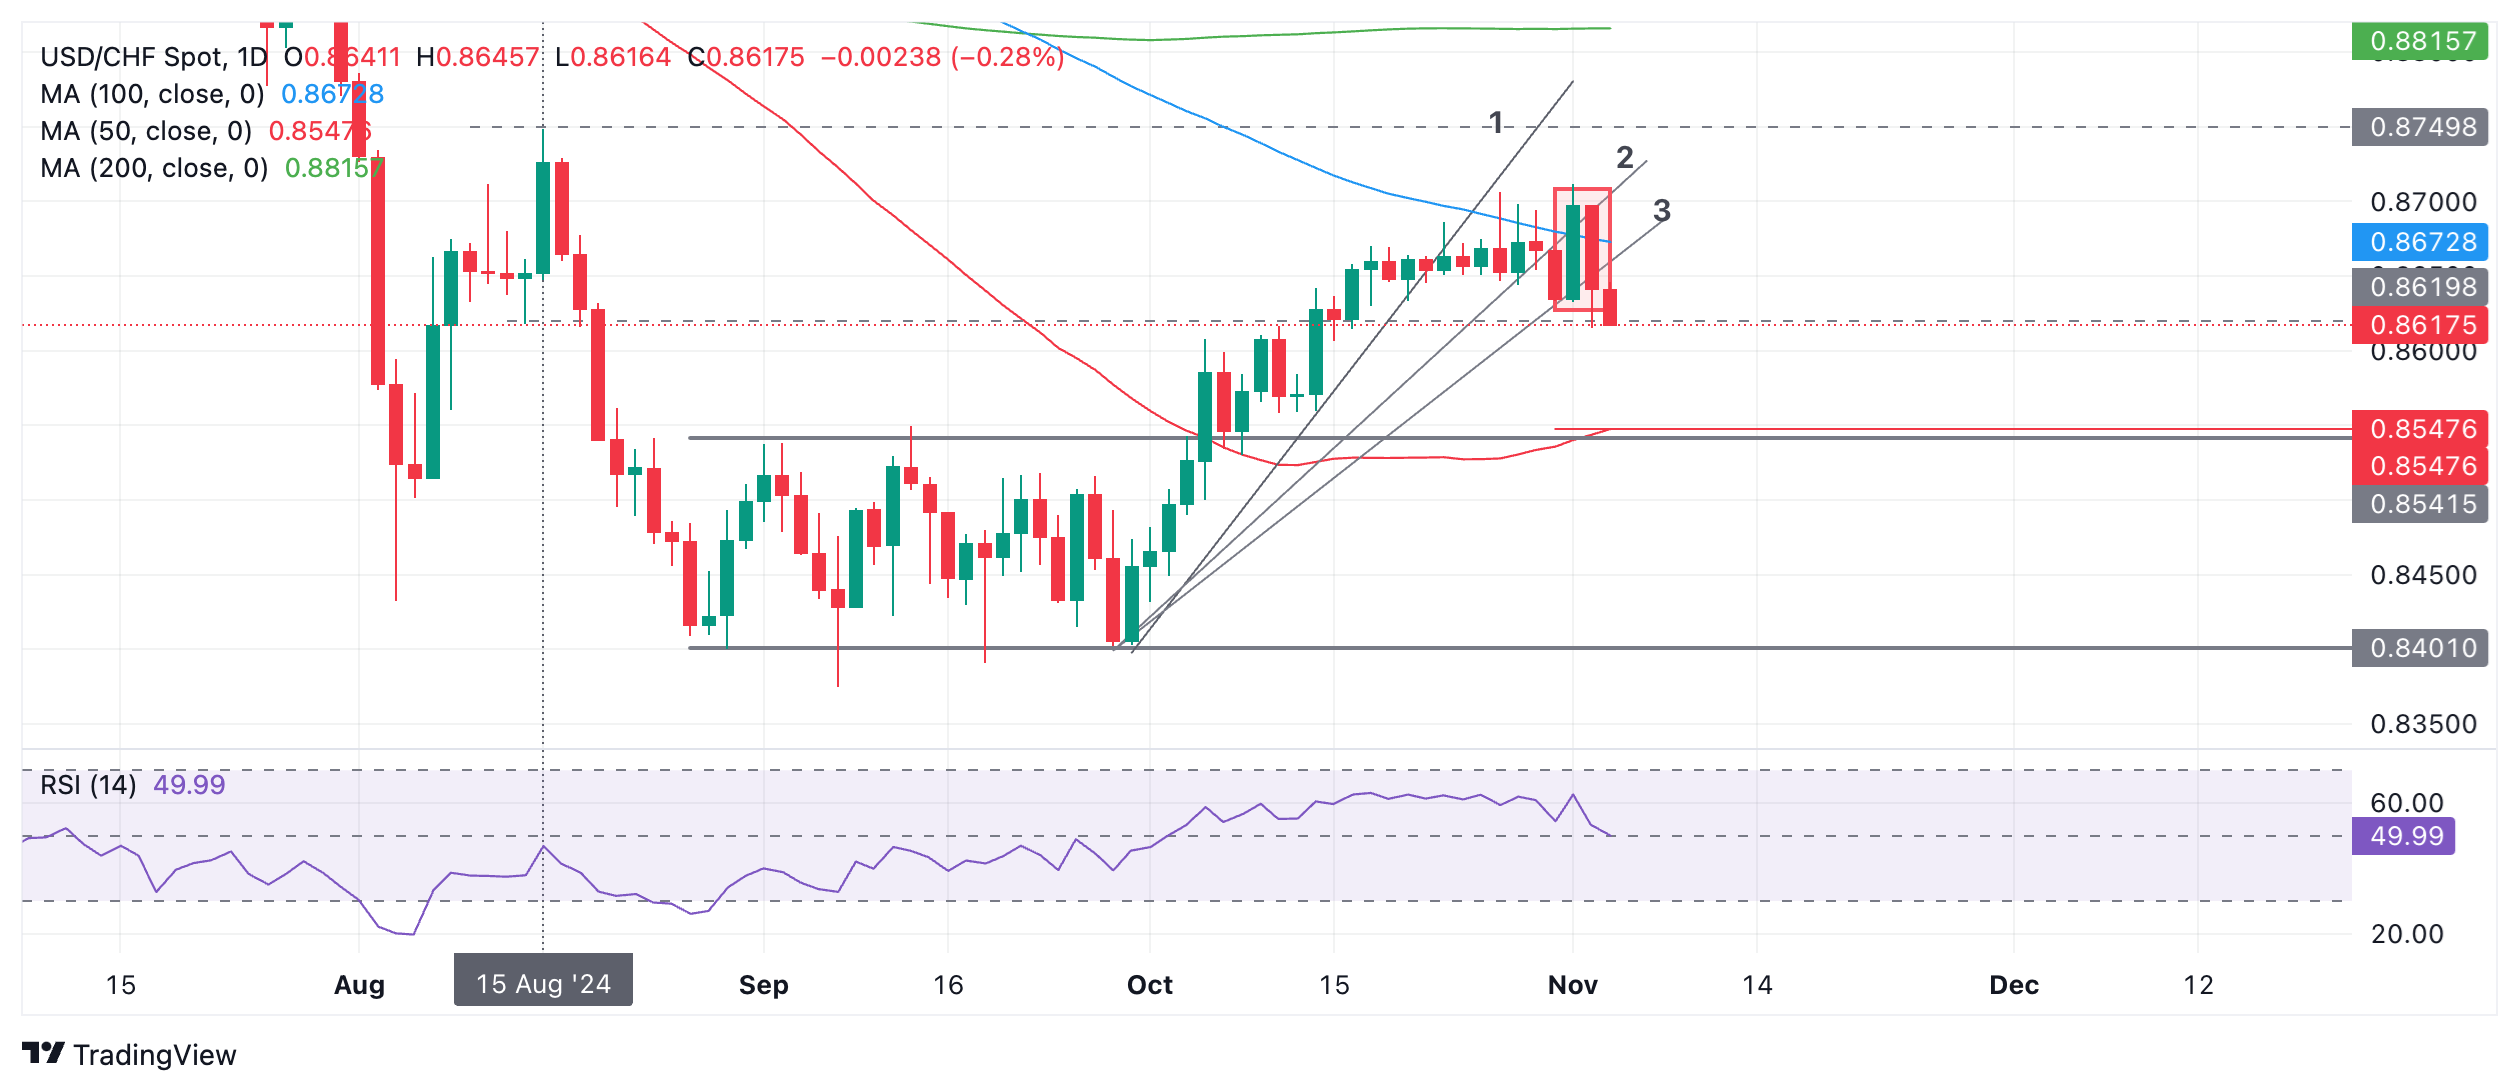
USD/CHF has formed a bearish Two-Bar reversal pattern (red-border rectangle on chart above) on Monday and Friday. These patterns occur at the end of an uptrend when a longer-than-average long, green candle is followed by a similar length and shape bearish red candle. The pattern indicates a reversal in sentiment. It usually denotes near-term weakness at the very least, more often than not a reversal of trend.
Further the trendline for the rally during October has been broken and redrawn three times (see 4-hour chart below for more detail) and this is another sign of a possible reversal according to technical analysis theory.
USD/CHF 4-hour Chart
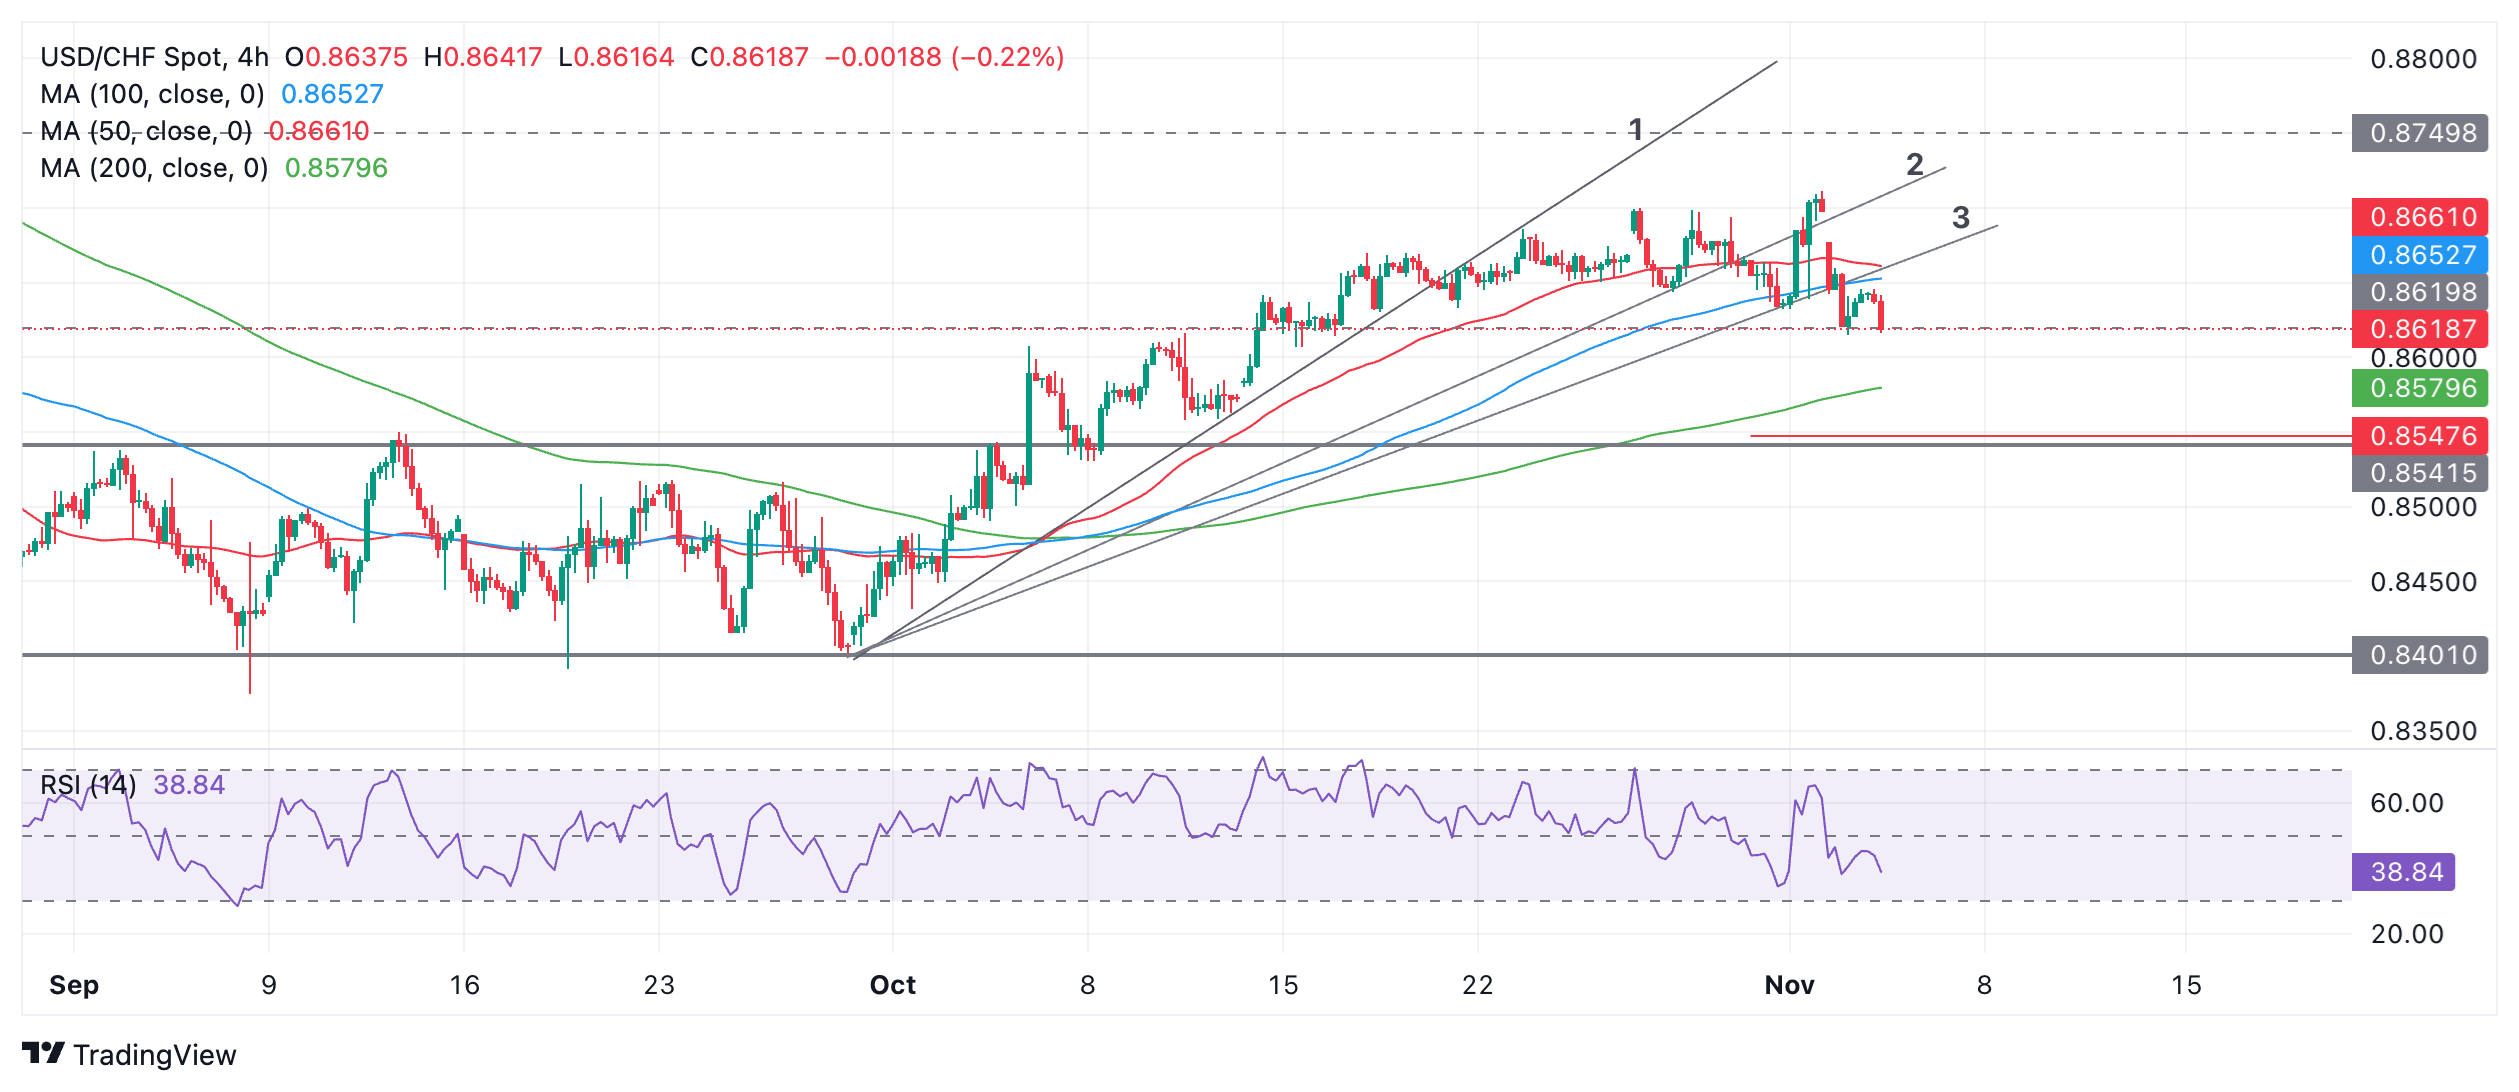
A break below the 0.8615 November 4 low would provide final confirmation of more downside to come and probable establishment of a downtrending bias. Such a break might reach the next target at around 0.8550 where the 50-day Simple Moving Average is located.