USD/JPY finds a floor at 105.26 as Trump impose tariffs on China.
- Trump plans to impose tariffs on China, reviving trade war fears.
- USD/JPY is trading at the lower end of its multi-week range.
The USD/JPY is trading at around 105.73 down 0.28% on the day as the White House takes steps to restrict Chinese investment and to put tariffs on $50B in Chinese imports for stealing technology. Any protectionist news can be interpreted by the market as USD bearish. However, so far the USD seems quite supported with the dollar index trading at 89.83 but showing signs of bull exhaustion at the time of writing.
In the US, Friday will see FOMC´s Member Bostic delivering a speech at 12.10.
Coming up next in Japan is the National CPI dataset which is not as popular as the Tokyo CPI.
Earlier in the US Session, we saw the Initial Jobless Claims for the week ended March 16th coming worse-than-expected while the Continuing jobless claim came in at 1.828m better than anticipated. The Housing Price Index and the Markit Manufacturing PMI in March came both above expectation.
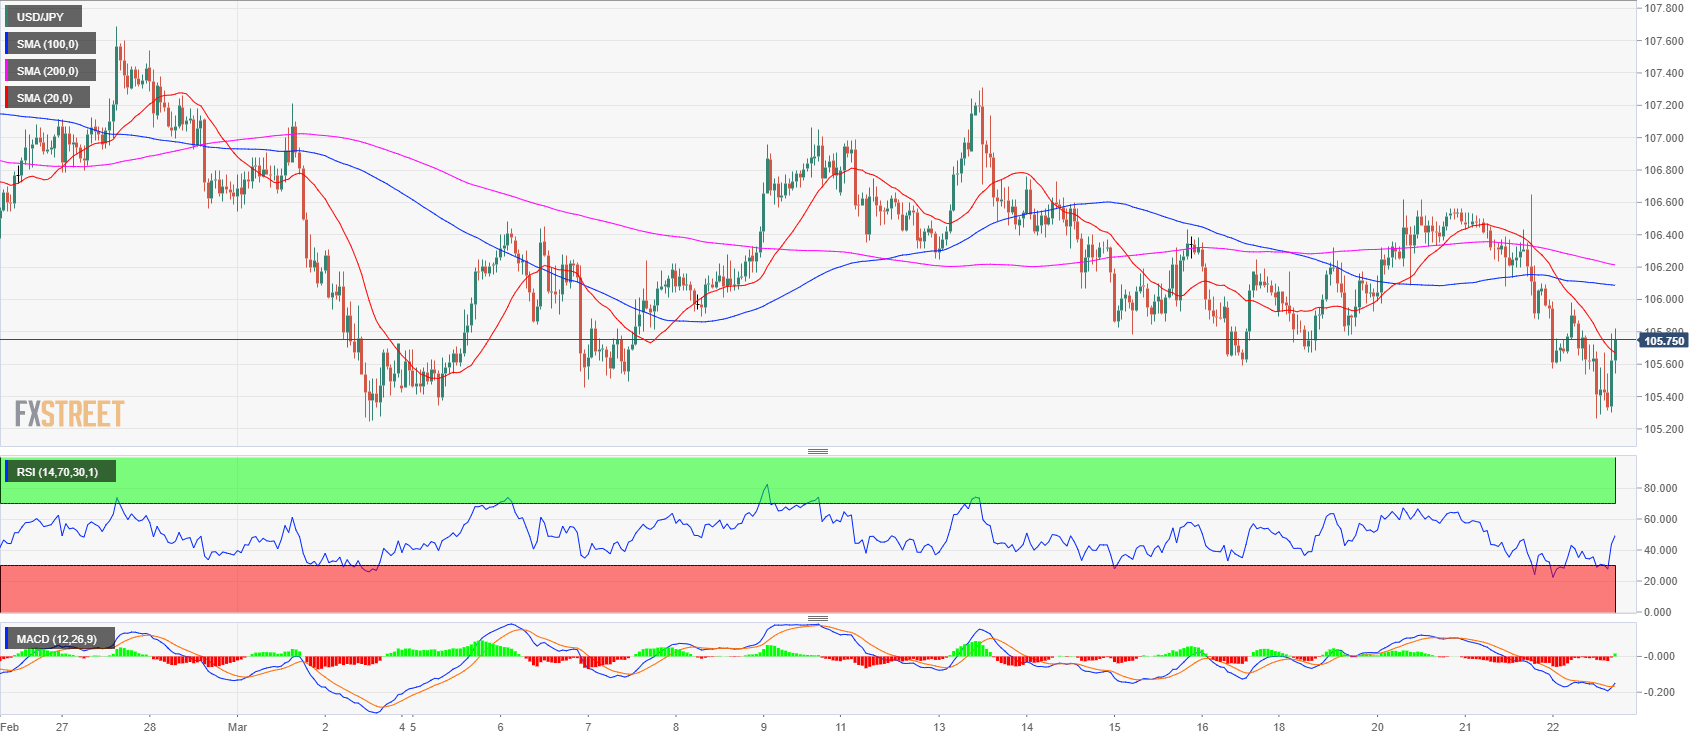
USD/JPY 1-hour chart

The bulls found support at the 105.26 level earlier in the European session and the market managed to bring it up to 105.80 before finding resistance. The bulls broke above the 20 SMA which is seen as an encouraging sign for further higher prices.
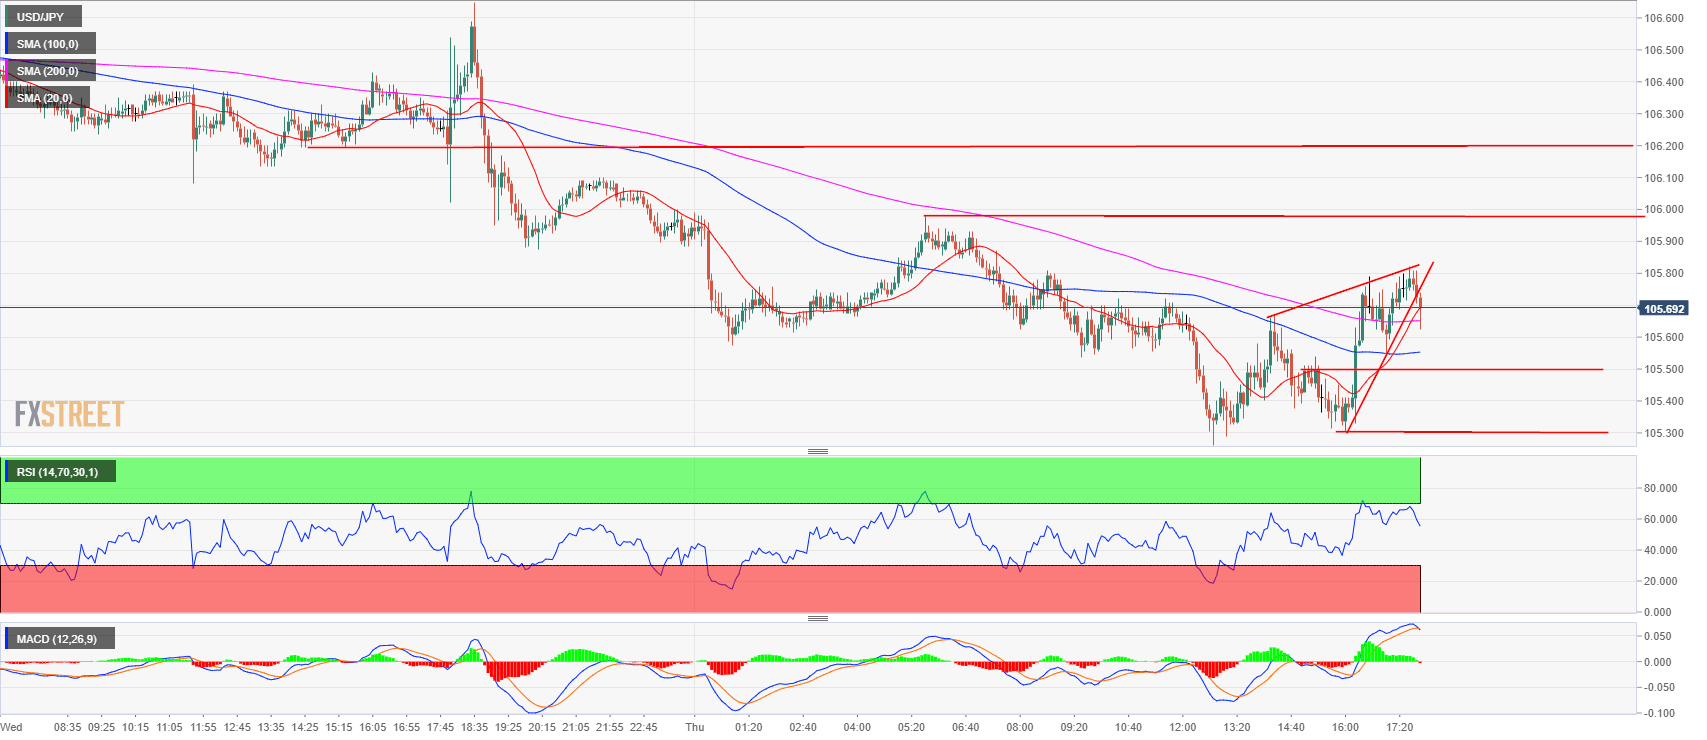
USD/JPY 5-min chart

The USD/JPY on the 5-minute chart has formed a wedge pattern at the 105.80 resistance. The structure implies that we could see some resistance at this level. However, if the wedge fails we might have a breakout equal to the bull leg we say today from the bottom at 105.26. Support is seen at 105.50 previous supply zone and 105.30 previous swing low. Resistance is seen at 106 previous high and at 106.20 previous supply zone.
