Back
12 Jun 2018
EUR/AUD Technical Analysis: Upside could soon gather traction
- The EUR/AUD 15-minute chart shows a bullish price-relative strength divergence (RSI).
- Indicates the pair could rebound from 1.5451 (5-day moving average) and rise to 200-day moving average of 1.55.
15-minute chart
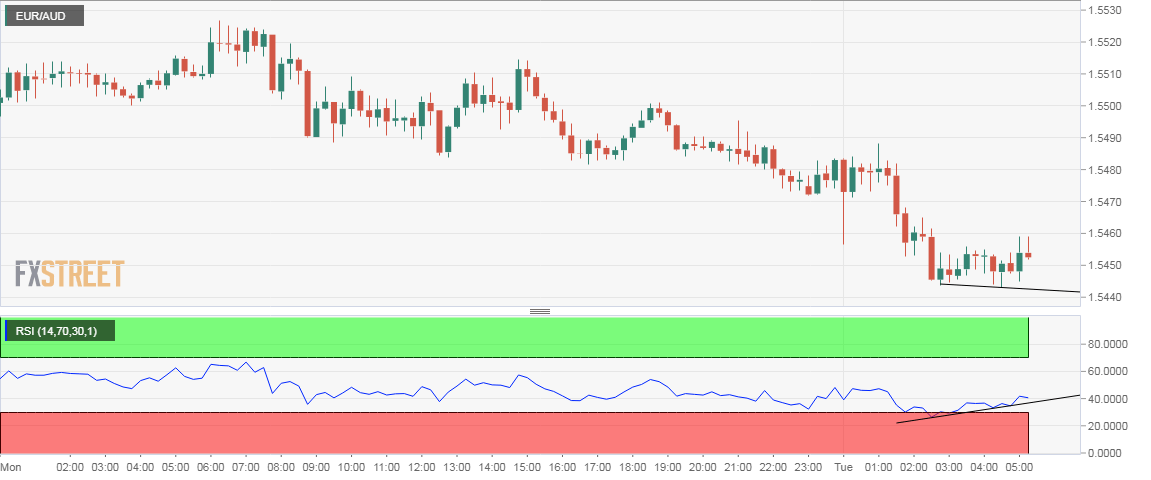
Spot Rate: 1.5457
Daily High: 1.5489
Daily Low: 1.5443
Trend: Bullish
Resistance
R1: 1.55 (200-day moving average)
R2: 1.5558 (June 8 high)
R3: 1.5606 (38.2% Fib R of April 25 - June 4 drop)
Support
S1: 1.5453 (100-hour moving average)
S2: 1.5419 (200-hour moving average)
S3: 1.54 (psychological support)