Back
13 Feb 2019
USD/CAD Technical Analysis: 1.3180 seems next in the sellers’ radar
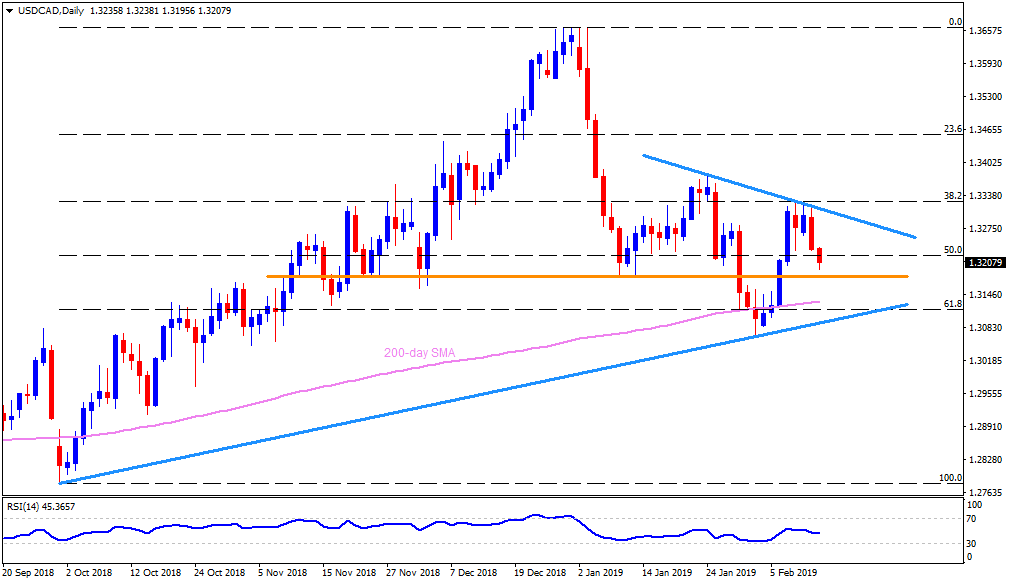
USD/CAD daily chart
- The Canadian Dollar (CAD) is on bids around 1.3200 against the USD during early Wednesday.
- The USD/CAD pair’s failure to surpass 38.2% Fibonacci retracement of October – December upside, signal brighter chances of its drop to 1.3185-80 horizontal support.
- Should the pair refrains to respect 1.3180 rest-point, the 200-day SMA level near 1.3130, followed by an upward sloping support-line at 1.3085 can challenge the sellers.
- Meanwhile, a descending resistance-line of 1.3315 and the 31.8% Fibo. level of 1.3330 seems adjacent resistances for the pair.
- Given the pair’s successful rise beyond 1.3330, 1.3380 and 1.3415 could play their role of resistance.
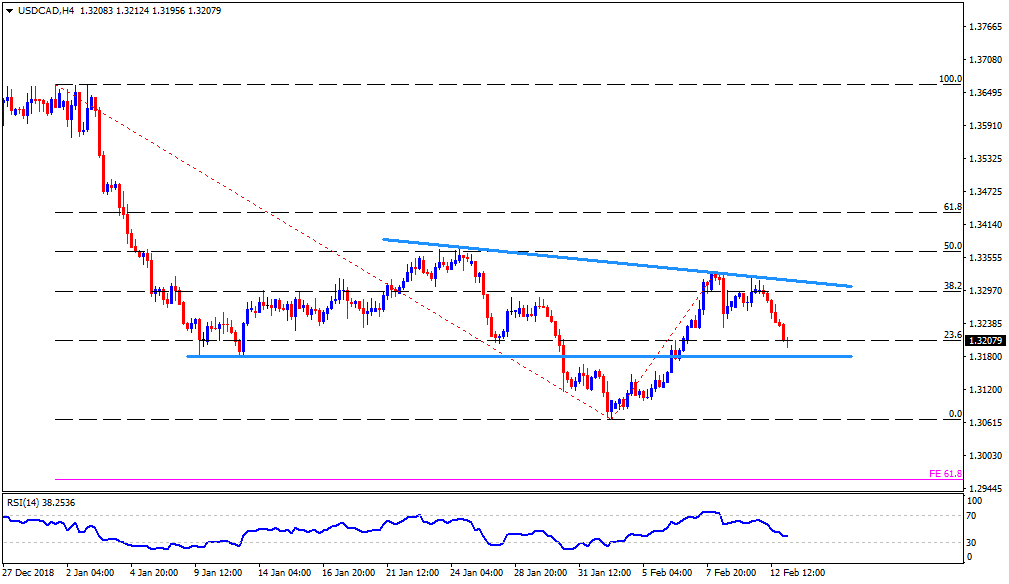
USD/CAD 4-Hour chart
- Looking closely, 1.3150 and 1.3115 can offer additional supports after 1.3180 whereas 1.3060 and 61.8% Fibonacci expansion of its moves ranging from late-December, at 1.2960, may grab the limelight afterward.
- On the upside, 1.3260 seem adjacent resistance prior to highlighting 1.3315 trend-line.
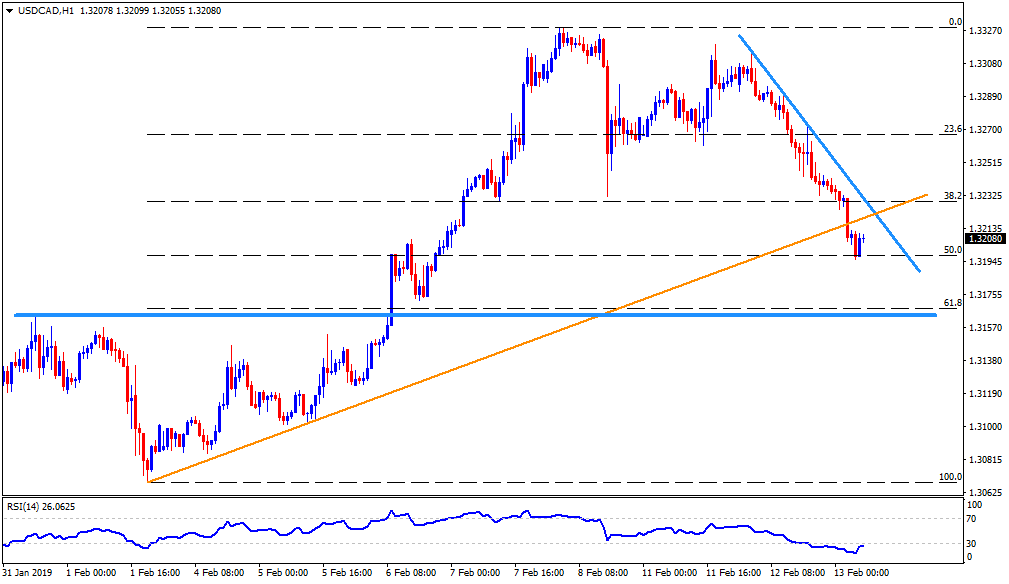
USD/CAD hourly chart
- In addition to 1.3260 resistance on H4 chart, the hourly picture emphasizes on immediate downward sloping trend-line, at 1.3230.
- Also, 1.3120 and 1.3100 could provide intermediate supports after 1.3150 breaks.