Back
25 Apr 2019
Oil Technical Analysis: WTI stays bullish near multi-month’s highs
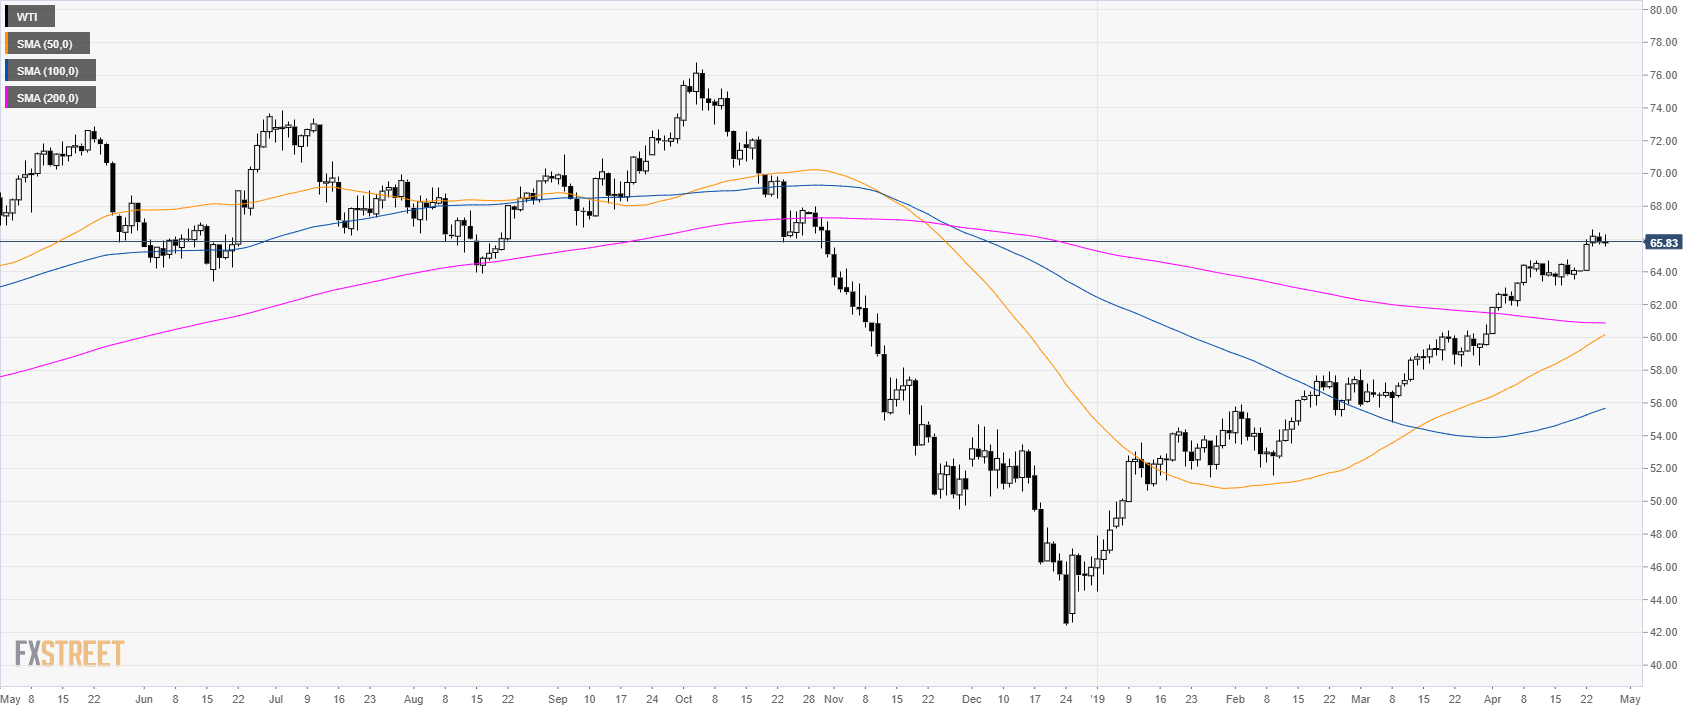
Oil daily chart
- WTI is trading in a bull trend above its main simple moving averages (SMAs).
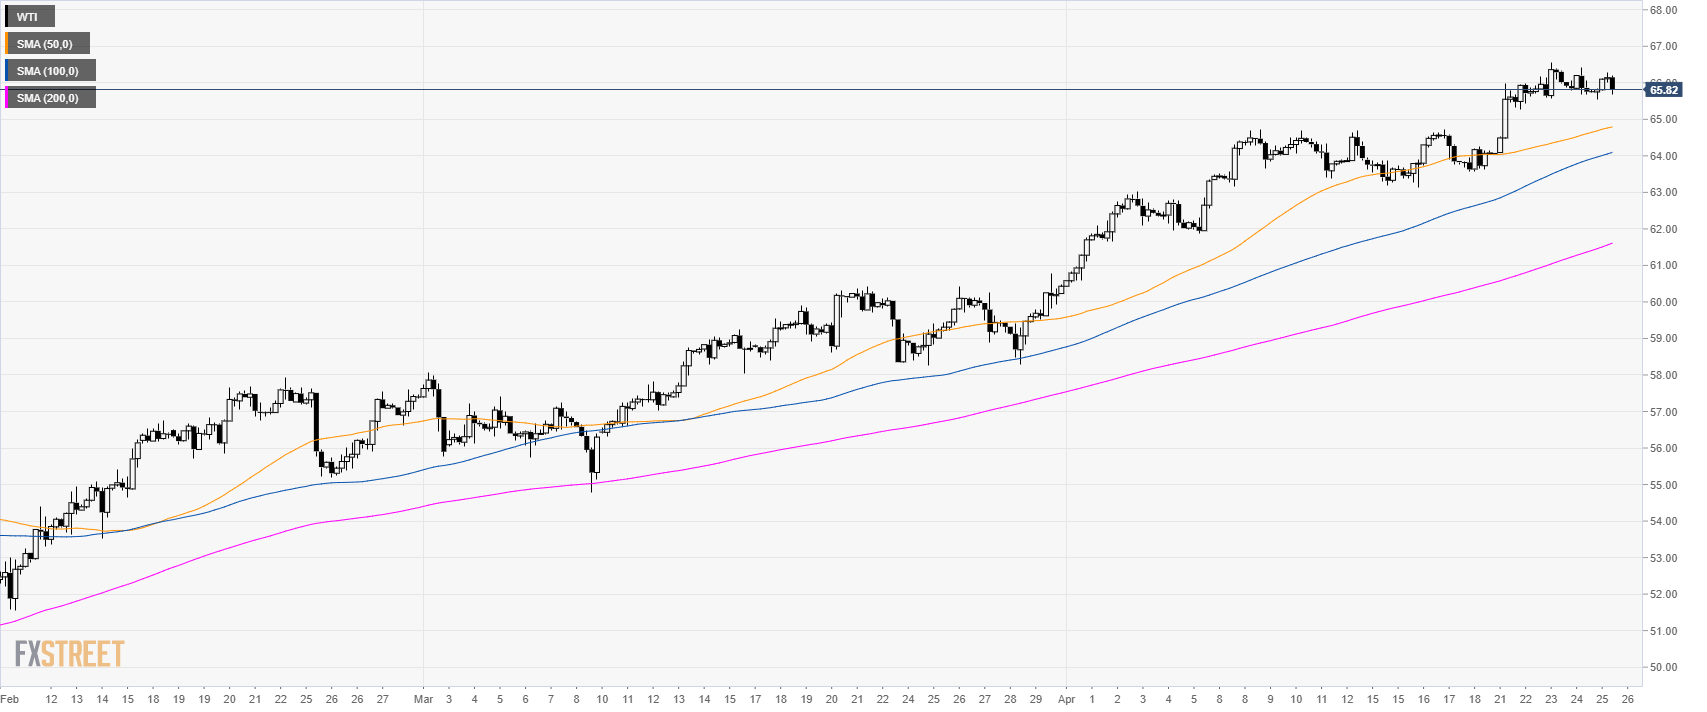
Oil 4-hour chart
- Crude oil bull trend remains intact above $66.00 a barrel.
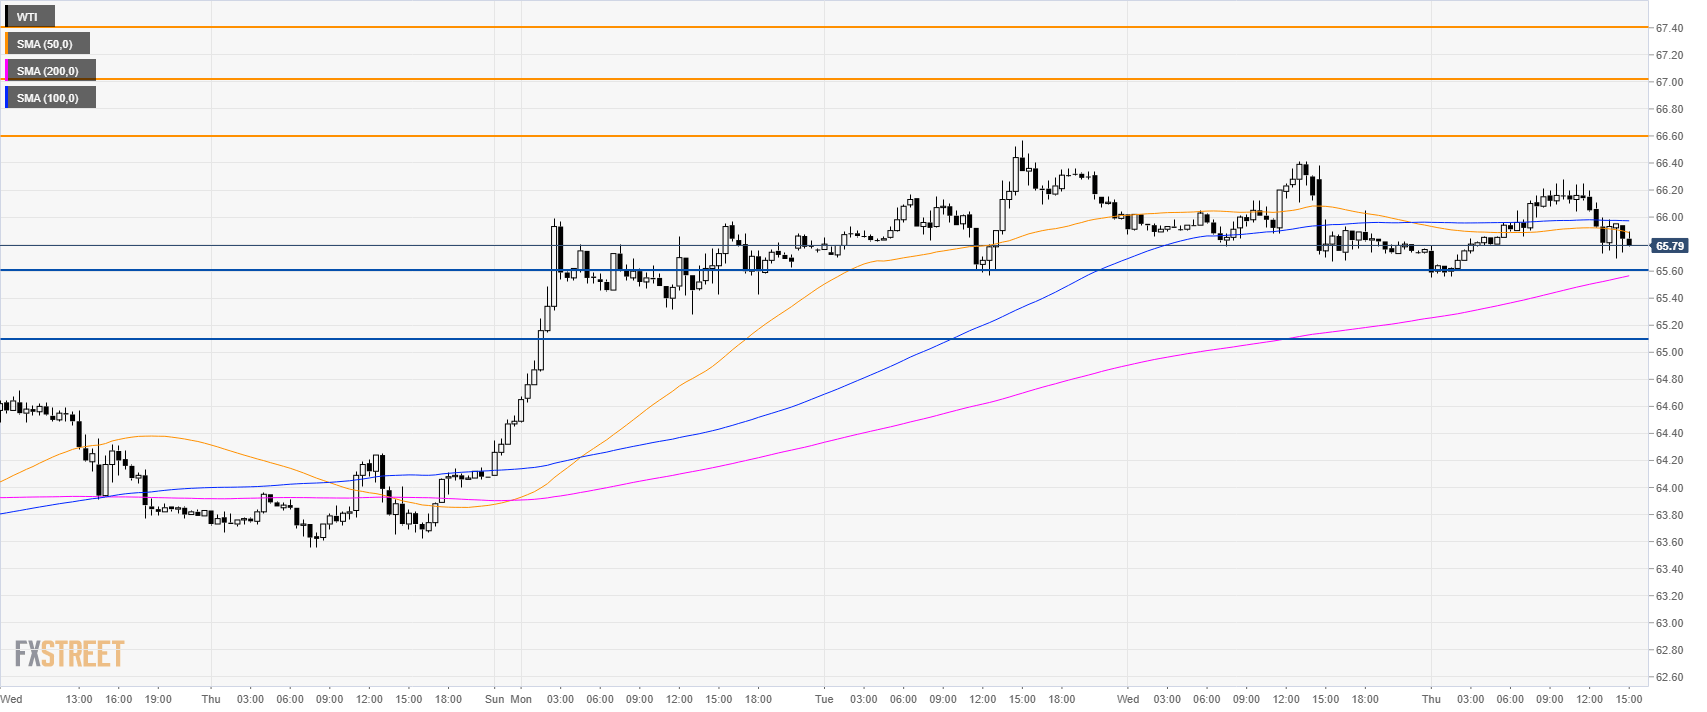
Oil 30-minute chart
- WTI is trading above its 200 SMA suggesting bullish momentum in the short-term.
- The level to beat for bulls is the 66.60 level followed by 67.00 and 67.40.
- Support is seen initially at 65.60 and then 64.10 level.
Additional key levels