GBP/JPY technical analysis: Short-term resistance-line questions 200-HMA breakout
- GBP/JPY breaks 200-HMA but immediate trend-line resistance limits the upside.
- A successful break can propel the quote to 61.8% Fibonacci retracement whereas 100-HMA acts as nearby important support.
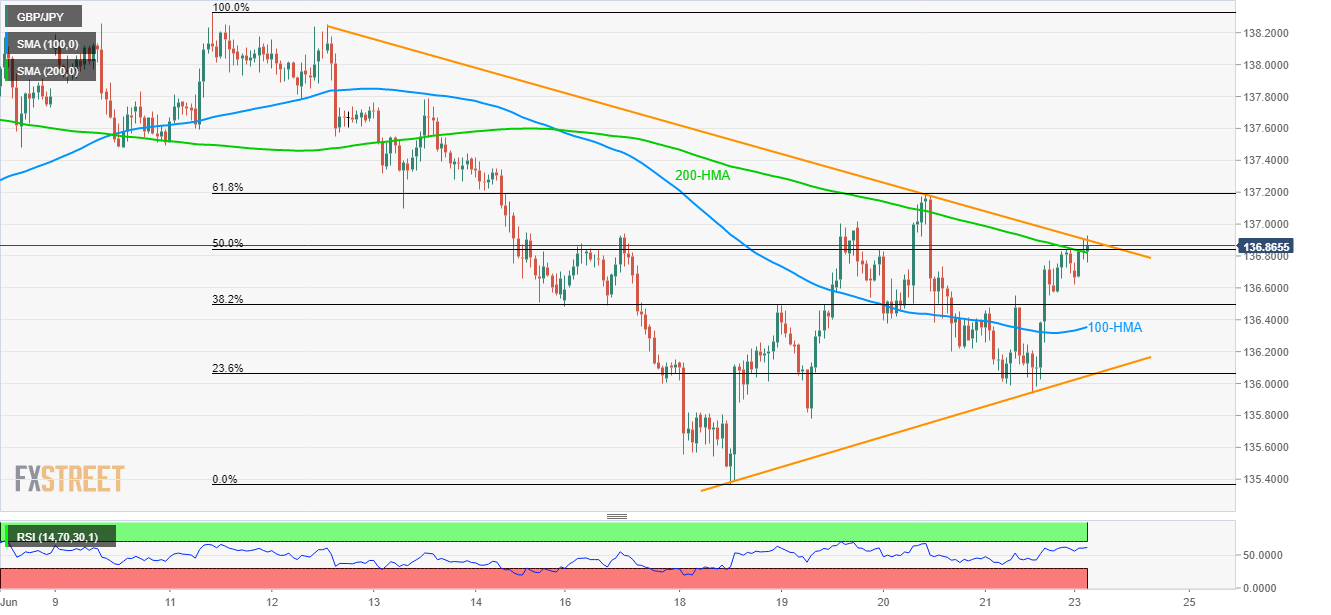
GBP/JPY breaks 200-HMA but is yet to cross 12-day long resistance-line as it takes the rounds to 136.85 during early Monday.
Should the pair successfully clears 136.90 trend-line barrier, it can quickly rise to 61.8% Fibonacci retracement of mid-month declines, at 137.19.
During the quote’s further upside past-137.19, June 13 top around 137.80 becomes the key for buyers as a break of which could escalate the up-moves to 138.00 and June 11 high near 138.33.
Alternatively, pair’s slip beneath 200-hour moving average (HMA) and 50% Fibonacci retracement confluence close to 136.80 highlights 136.36 as next major support comprising 100-HMA.
If sellers refrain from respecting 136.36, immediate upward sloping trend-line and 23.6% Fibonacci retracement near 136.00 can question the bears, if not then 135.80 and month’s low at 135.37 may please them.
GBP/JPY hourly chart
Trend: Pullback expected