USD/JPY technical analysis: 107.77/81 caps latest bounce off 23.6% Fibo.
- USD/JPY’s pullback from 23.6% Fibonacci retracement needs to clear 107.77/81 horizontal-resistance.
- Oversold RSI favors the pair’s rise to 21-DMA if it manages to clear immediate upside barrier.
While oversold levels of 14-day relative strength index (RSI) might have played its role in fetching the USD/JPY pair upwards, the quote still needs to clear nearby horizontal-resistance in order to justify its strength as it takes the rounds to 107.37 during early Monday.
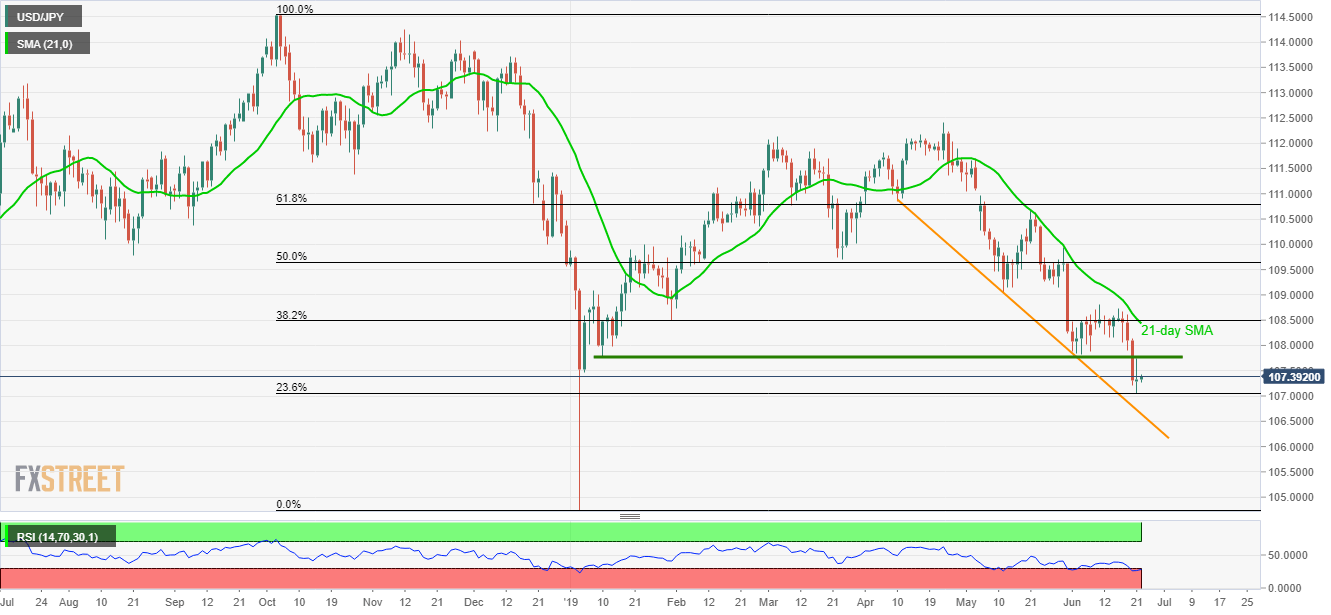
An area comprising lows of January 10 and June 05 questions the pair’s latest uptick targeting 21-day simple moving average (SMA) level of 108.44.
Should oversold RSI manages to propel prices beyond 108.44, current month top surrounding 108.80 and May month low near 109.01 can entertain buyers.
Meanwhile, pair’s decline below 107.06 comprising 23.6% Fibonacci retracement of October 2018 to January 2019 decline can drag it to a descending trend-line stretched since early April, at 106.64.
It should also be noted that pair’s extended south-run past-106.64 may avail 106.00 and 105.00 round-figures as intermediate halts before revisiting the yearly low near 104.75.
USD/JPY daily chart
Trend: Pullback expected