USD/JPY technical analysis: Bearish MACD, rising wedge keep sellers on alert
- USD/JPY pulls back from early-August levels.
- Failure to sustain run-up, bearish MACD portrays pair’s weakness inside a three-week-old rising wedge.
- A downside break of 107.55/50 support-confluence will confirm the bearish pattern.
Despite rising to multi-week high, USD/JPY fails to sustain the strength as it pulls back to 108.15 during early Tuesday.
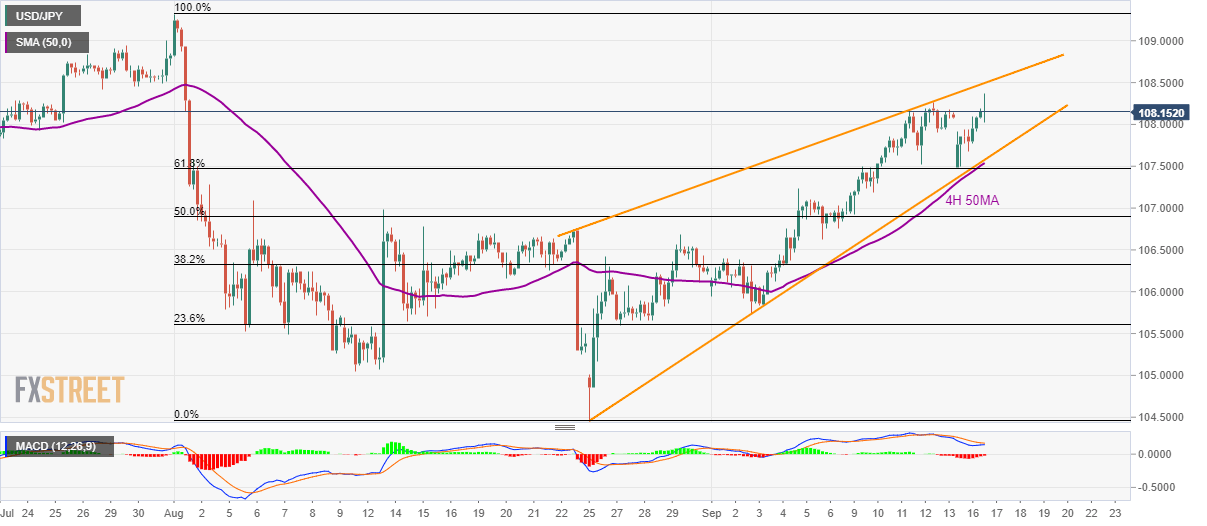
In addition to the profit-booking move, the bearish signal from 12-bar moving average convergence and divergence (MACD) indicator also highlights the three-week-old rising wedge bearish pattern that gets confirmation on the downside break of 107.55/50 area, which includes 50-bar moving average on the four-hour chart (4H 50MA).
In doing so, the quote could slump to late-August highs surrounding 106.70 whereas 23.6% Fibonacci retracement of August month downpour, at 105.60, and 105.00 will entertain sellers afterward.
Alternatively, an upside clearance of 108.50 will negate the bearish formation and can propel prices further towards August month high near 109.30.
USD/JPY 4-hour chart
Trend: pullback expected