AUD/USD technical analysis: Nearing key resistance at 0.6719
- AUD/USD has charted a double bottom pattern on the hourly chart.
- A break above the neckline resistance of 0.6719 is needed to confirm a bullish breakout.
AUD/USD is flashing green at press time despite the weak Australian trade data. The currency pair needs to rise above key resistance at 0.6719 to confirm a bullish breakout.
As of writing, the currency pair is trading at 0.6714, representing 0.13% gains on the day, having hit a high of 0.6717.
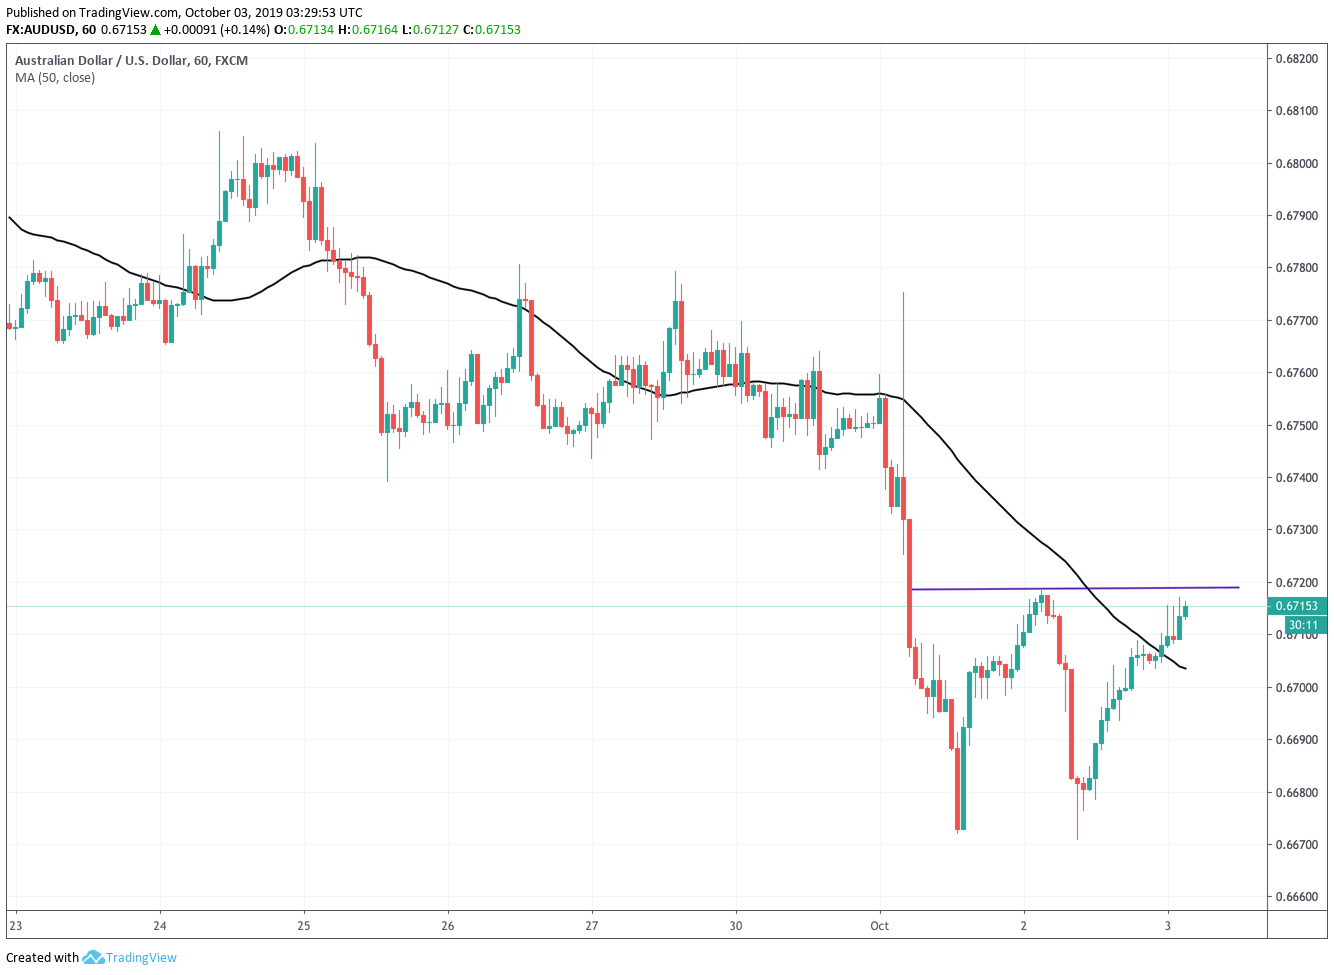
On the hourly chart, the pair has charted a double bottom pattern with the neckline resistance at 0.6719. Acceptance above that level would confirm a double bottom breakout or a bearish-to-bullish trend change.
A breakout, if confirmed, would open the doors for 0.6767 (target as per the measured move).
The bullish case would weaken if the pair faces rejection at the double bottom neckline and falls below the descending (bearish) 50-hour MA, currently at 0.6703.
Hourly chart
Trend: Bullish above 0.6719
Technical levels