AUD/JPY technical analysis: Breaks three-week-old support trendline
- AUD/JPY reverses from three-month high, drops below the near-term key support line.
- 21-day EMA seems to be the immediate rest-point, multiple resistances stand tall to challenge the buyers, if any.
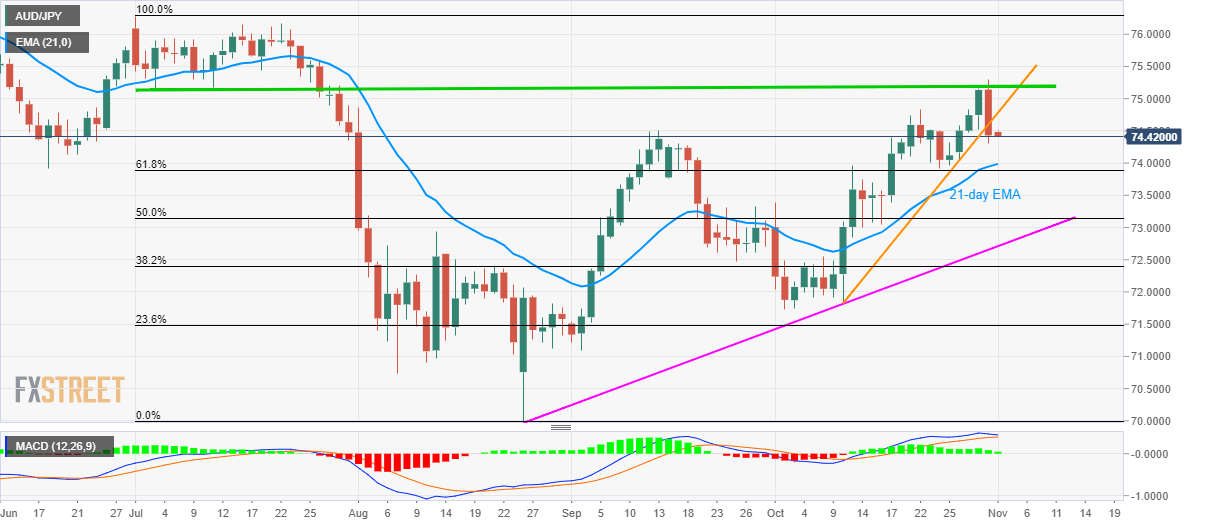
Following its U-turn from late-July tops, AUD/JPY declines below the three-week-old rising support line while flashing 74.42 as a quote during Friday’s initial Asian session.
Prices are likely aiming for a 21-day Exponential Moving Average (EMA) level of 74.00 whereas 61.8% Fibonacci retracement of July-August downpour, at 73.89, could question sellers next.
In a case where the bears refrain from respecting 73.89, October-start high near 73.35 and 50% Fibonacci retracement level of 73.15 could entertain them ahead of an upward sloping trend line since late-August, at 72.71.
Meanwhile, pair’s run-up beyond 75.13/20 area, including early-July lows to late-month highs, may find multiple upside stops around 75.50 and 76.00.
During the pair’s rise past-76.00, 76.30 and 77.00 will be on the bull’s radar.
AUD/JPY daily chart
Trend: pullback expected