Back
13 Nov 2019
AUD/USD technical analysis: Aussie off daily lows, stays under pressure below the 0.6850 level
- The Aussie is bouncing mildly from the daily lows after the London close.
- The level to beat for bears is the 0.6810 support level.
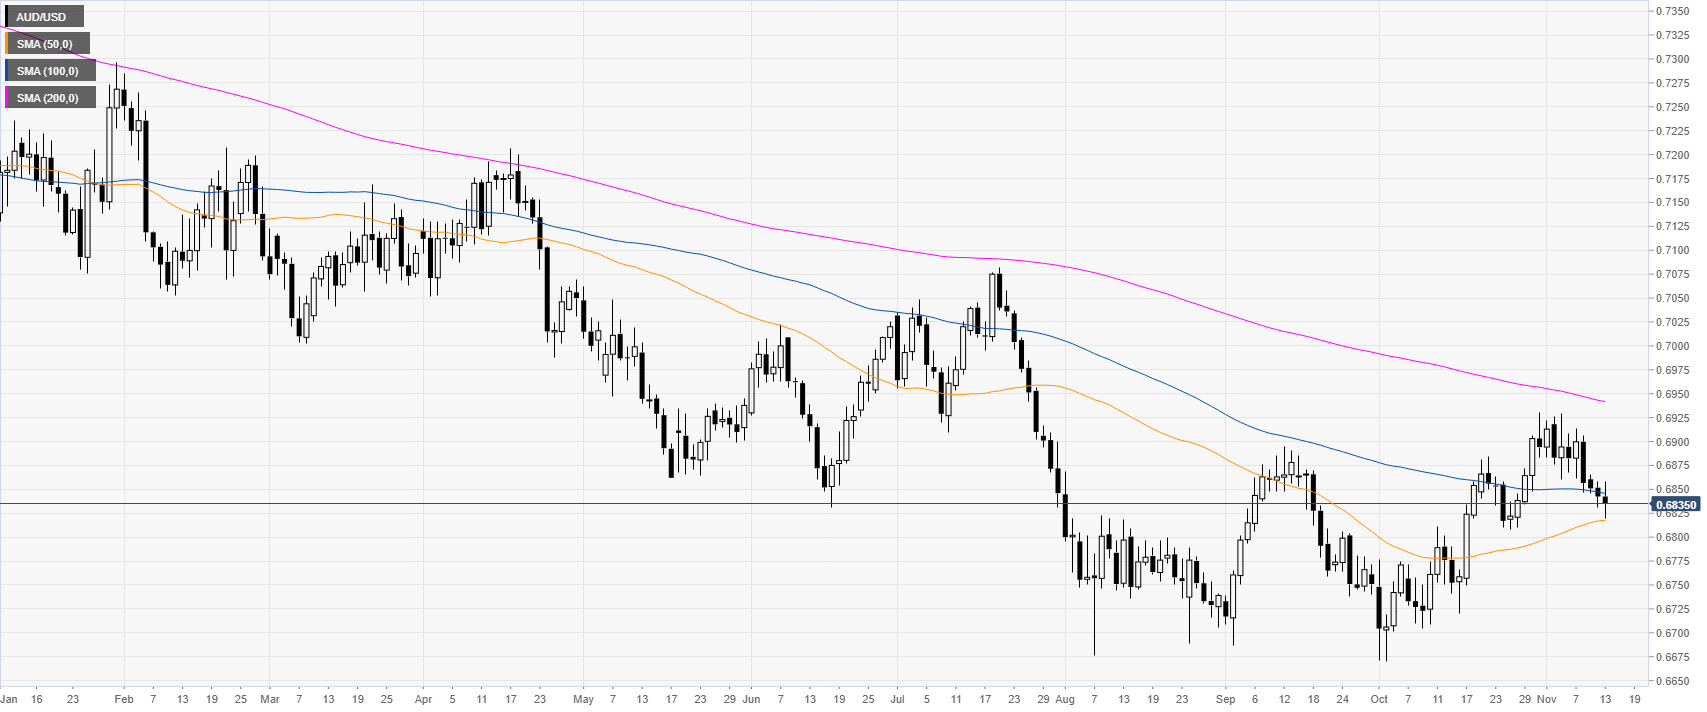
AUD/USD daily chart
The Aussie is trading in a bear trend below its 100 and 200-day simple moving averages (DMAs) on the daily chart. This Wednesday the Aussie keeps drifting down.
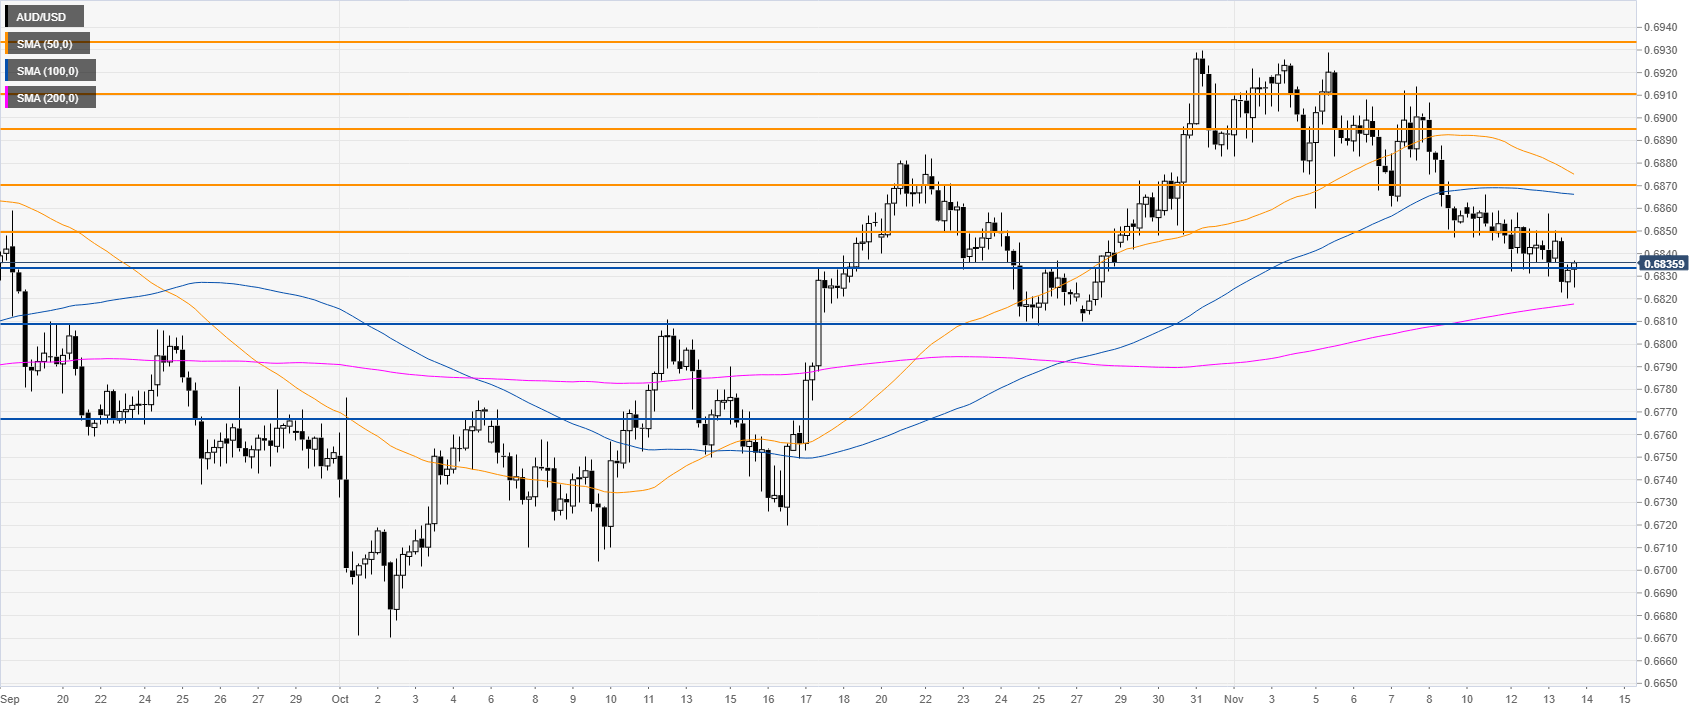
AUD/USD 4-hour chart
The market is trading off the November low just above the 0.6934 support level and the 200 DMA. The spot is drifting down and the sellers will likely be looking for a downside break below the 0.6810 support level. The next relevant support is seen at the 0.6766 level, according to the Technical Confluences Indicator.
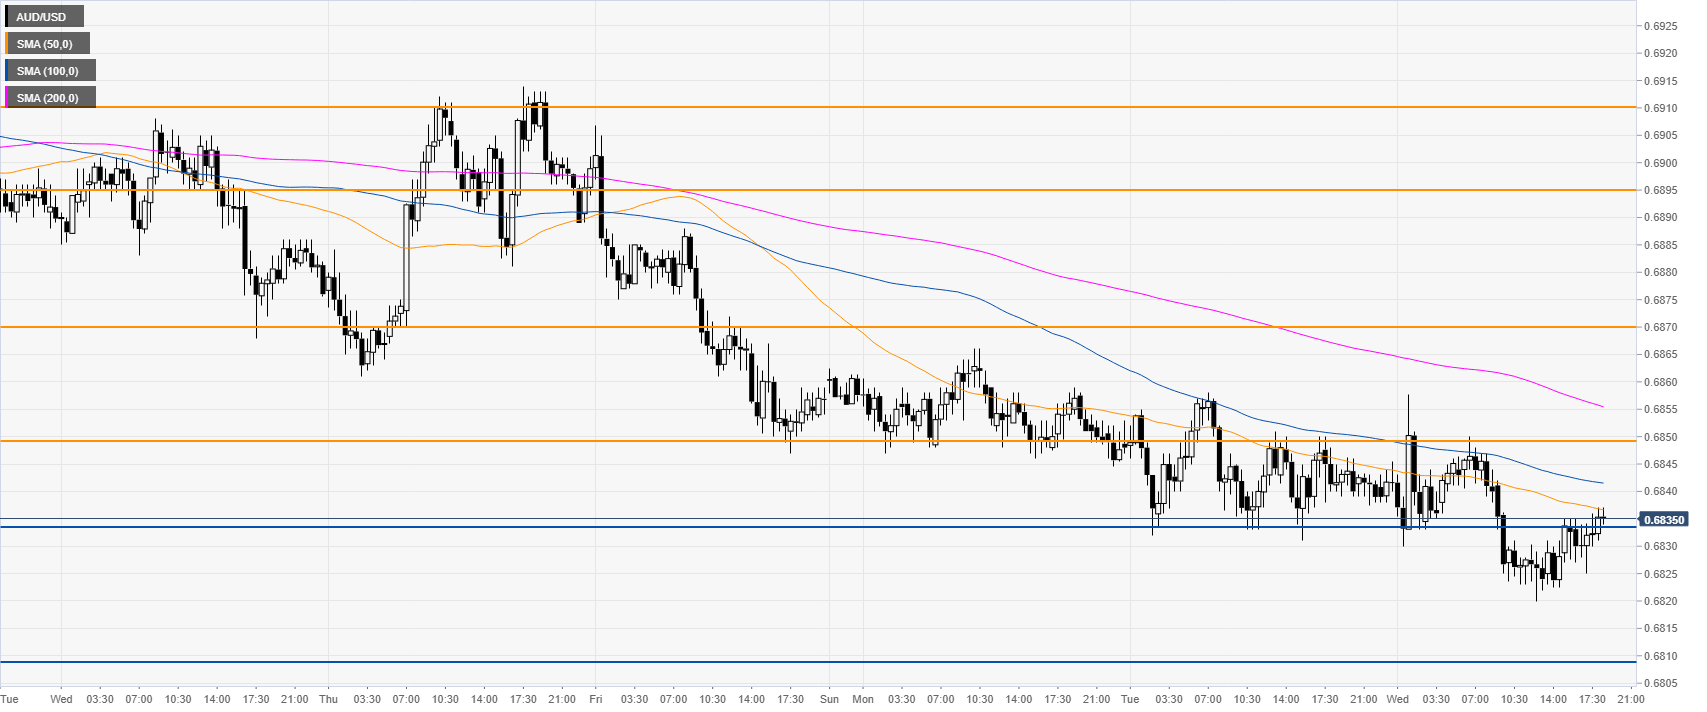
AUD/USD 30-minute chart
AUD/USD is under pressure below its main SMAs. Resistances are seen at 0.6850 and 0.6870 price levels, according to the Technical Confluences Indicator.
Additional key levels