Back

4 Dec 2019
USD/INR technical analysis: Greenback failed breakout above 71.90 against Indian rupee
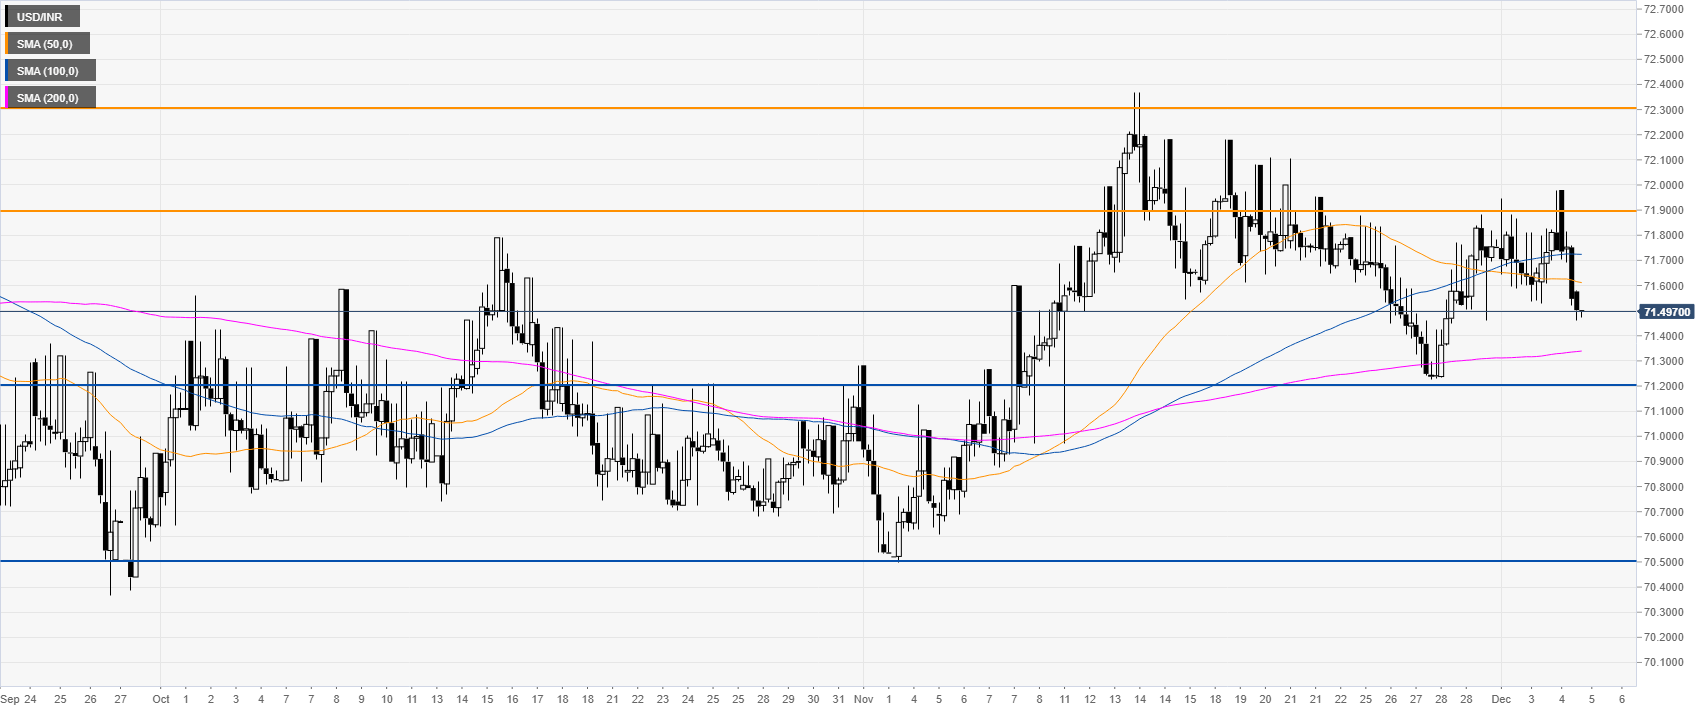
- USD/INR fails to break above the 71.90 resistance.
- USD/INR is set to remain trapped in a tight range in the medium term.
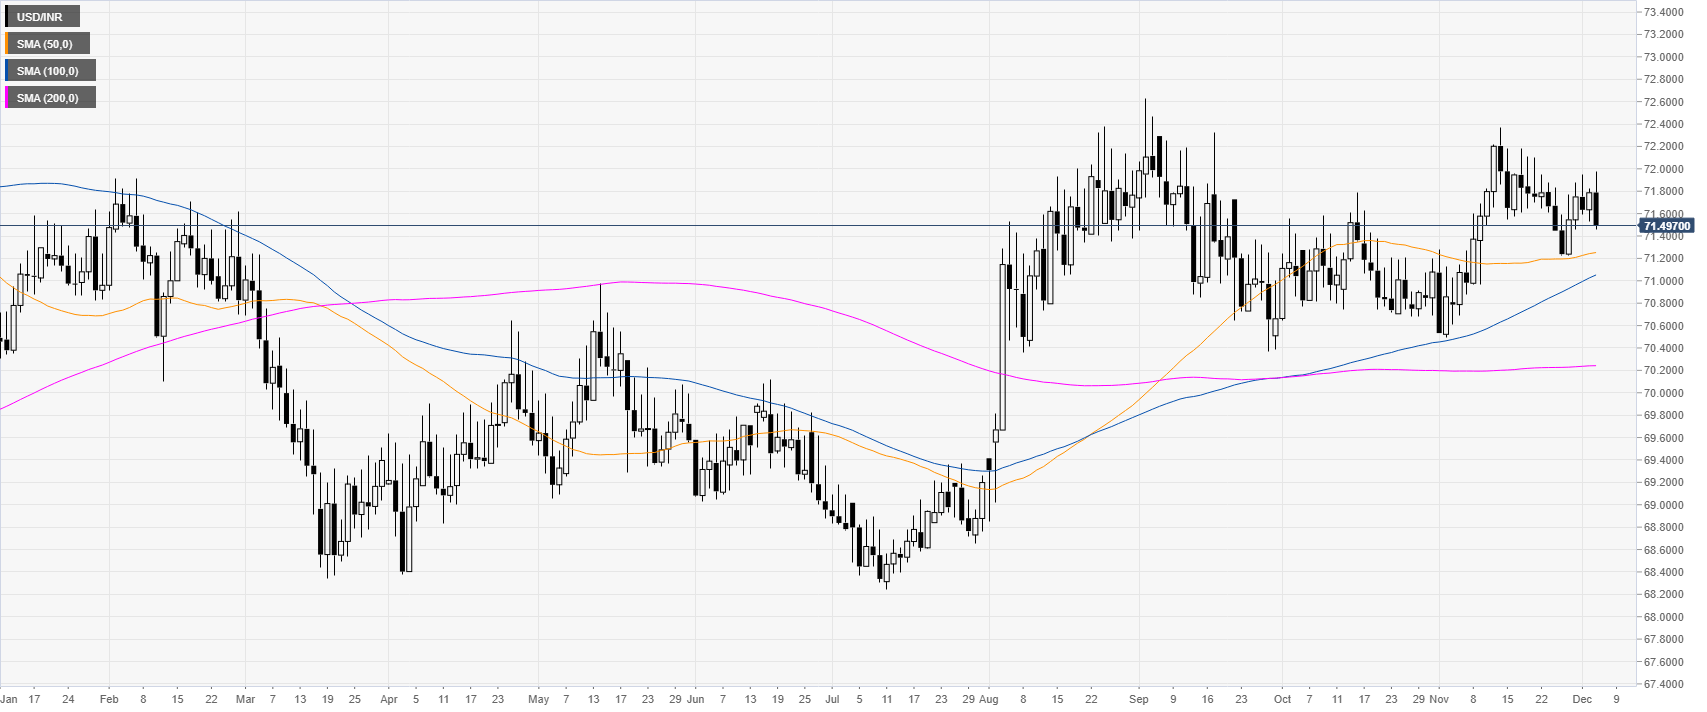
USD/INR daily chart
USD/INR is trading in a bull trend above its main daily simple moving averages (DMAs). The market formed a bull flag in November and now the price is consolidating above the 71.20 swing low.

USD/INR four-hour chart
The break above the 71.90 resistance failed as the bears rejected the price quite strongly. The market seems to trapped in the 7120-71.90 range in the medium term.
Additional key levels

