Back
5 Dec 2019
EUR/USD price analysis: Euro rolling into Asia sidelined above 1.1060 level
- EUR/USD is consolidating the recent gains above the 1.1060 price level.
- The level to beat for bulls is the 1.1093 resistance.
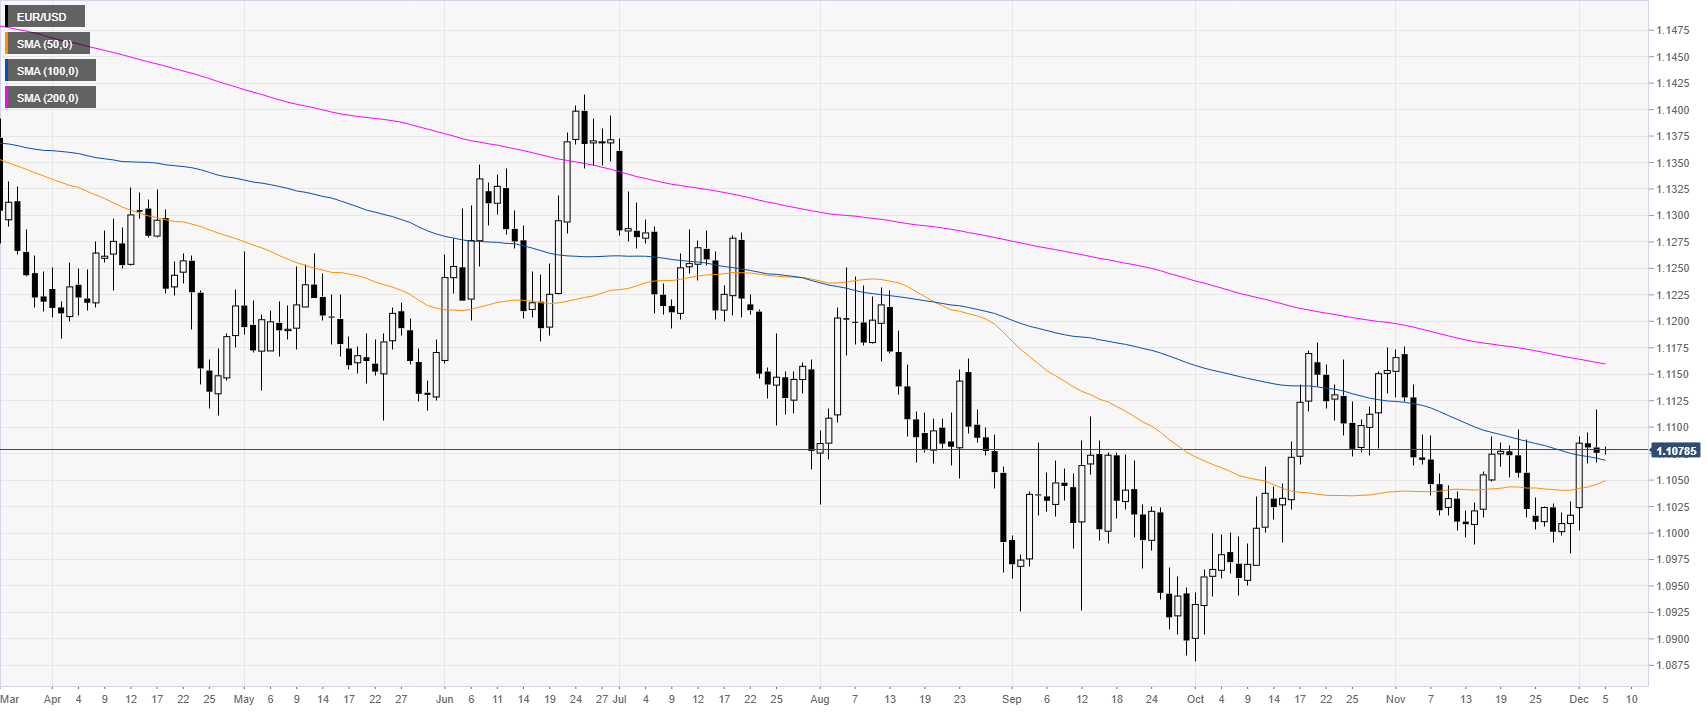
EUR/USD daily chart
On the daily chart, EUR/USD is trading in a downtrend below the 200-day simple moving average (DMA). However, this week, the market had a sharp reversal up above the 50 and 100 DMAs.
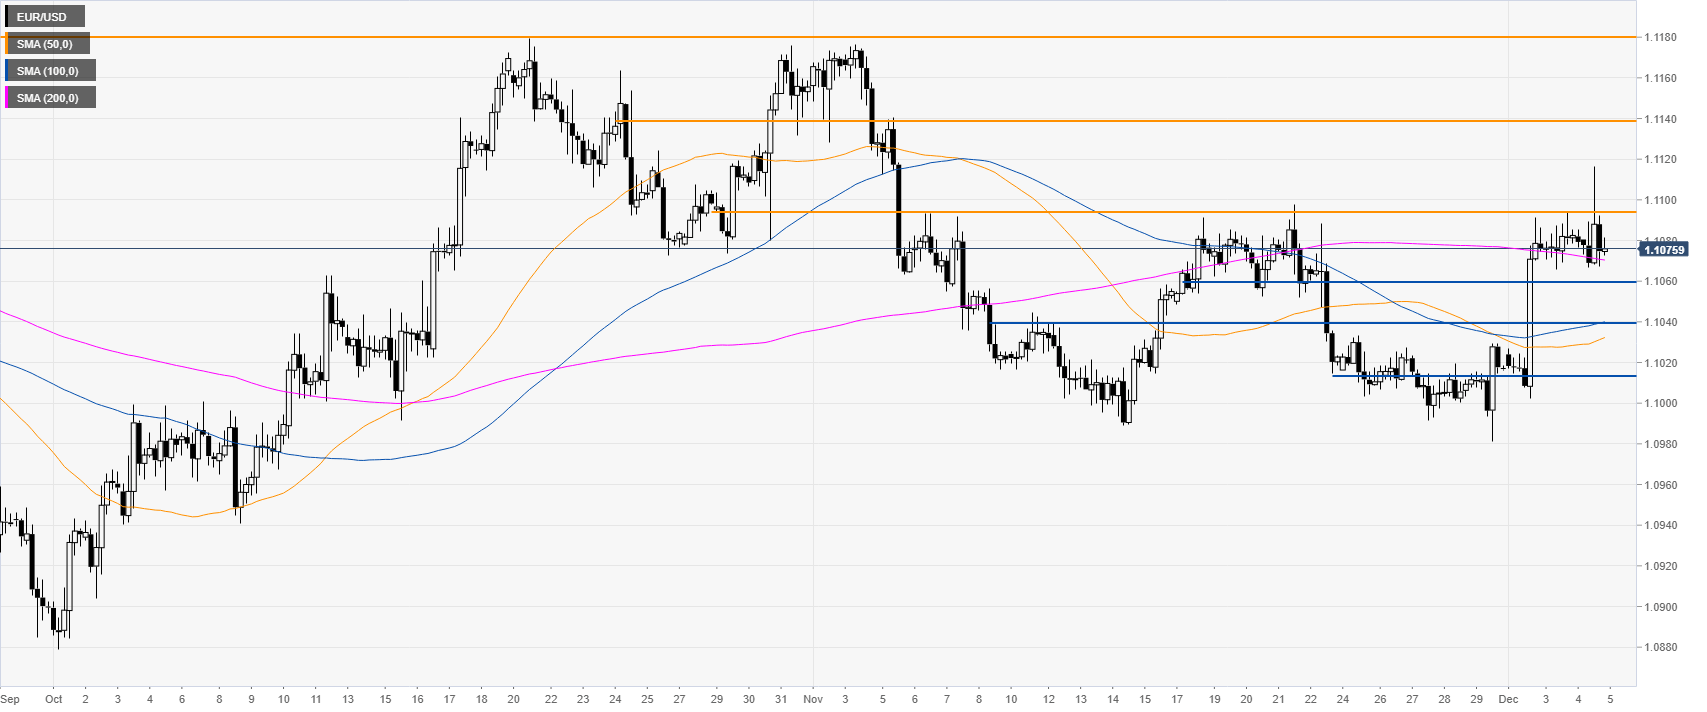
EUR/USD four-hour chart
EUR/USD is trading below the 1.1093 resistance while holding above the 200 SMA on the four-hour chart. If the spot can overcome this critical resistance on a daily basis, EUR/USD could continue its ascent towards 1.1139 and the 1.1180 level in the medium term, according to the Technical Confluences Indicator.
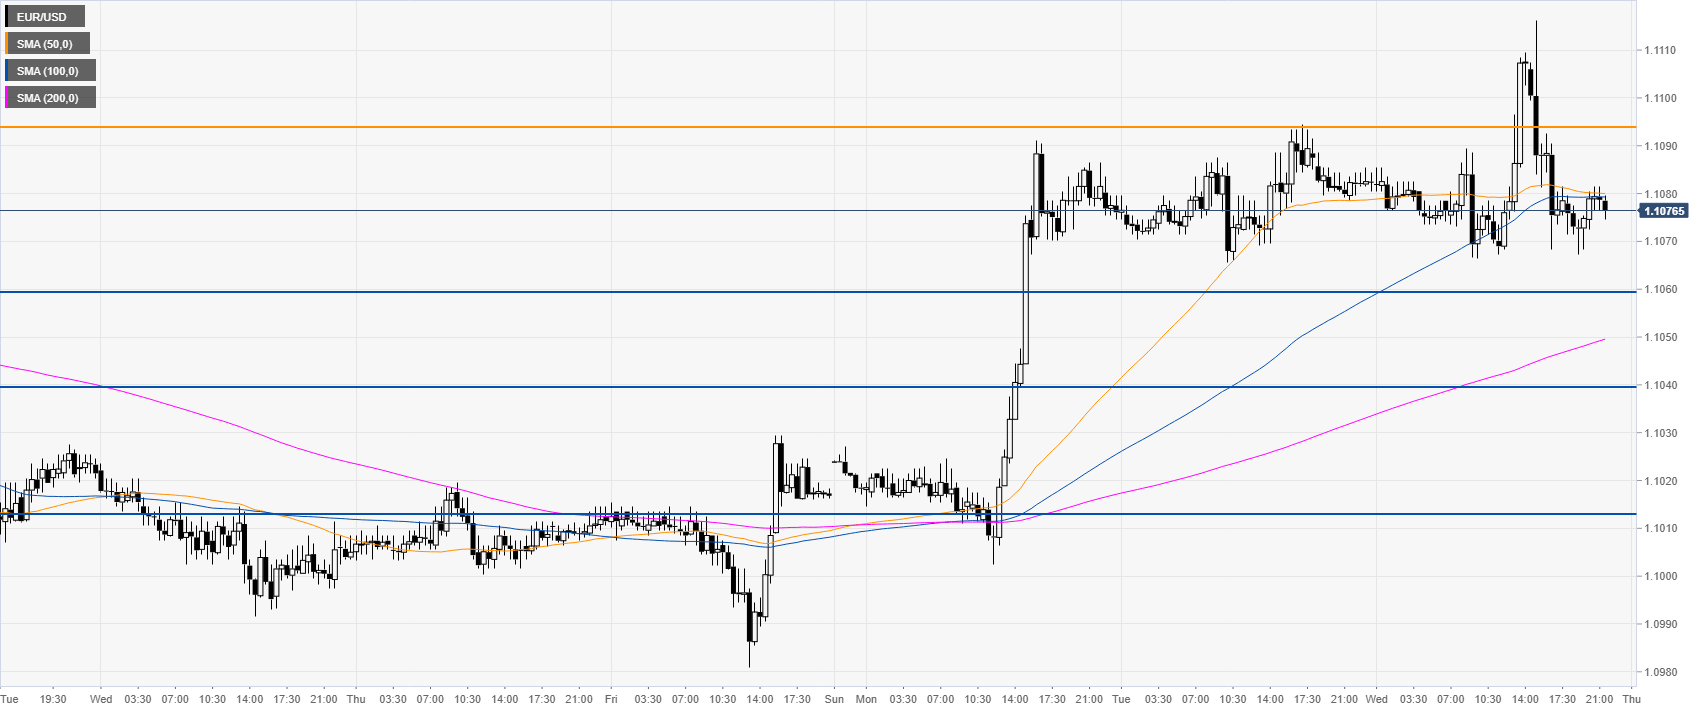
EUR/USD 30-minute chart
The euro continues the sideways consolidation theme above the 200 SMA. Support can be seen at the 1.1060, 1.1040 and 1.1013 price levels, according to the Technical Confluences Indicator.
Additional key levels