USD/INR Technical Analysis: 100-day EMA checks sellers near three-week low
- USD/INR extends losses to the third day in a row.
- 23.6% Fibonacci retracement, 200-day EMA act as additional supports.
- Buyers will look for entry beyond 61.8% Fibonacci retracement.
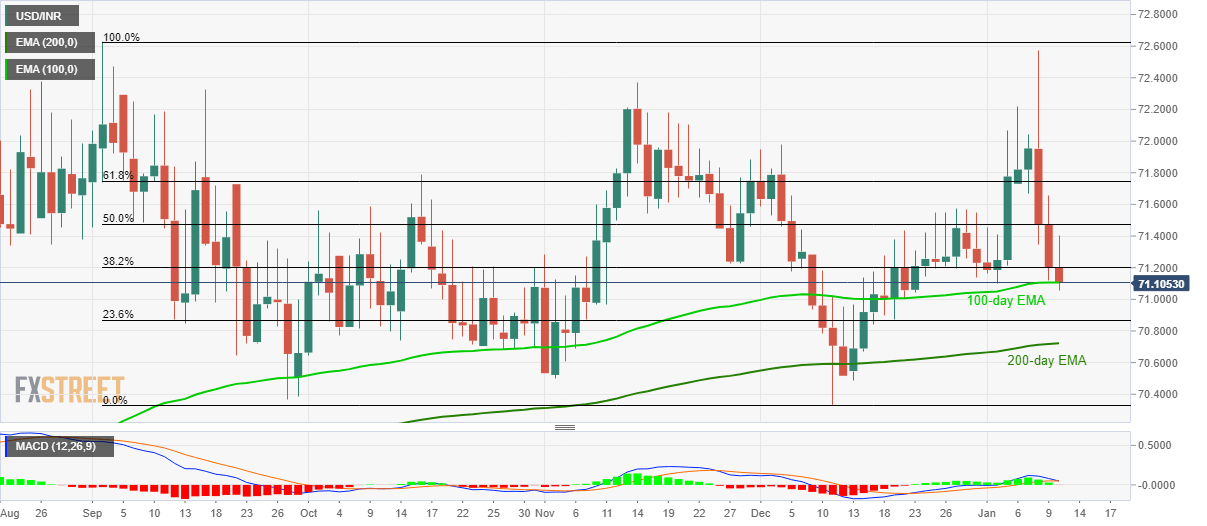
USD/INR declines to 71.12, after printing the low of 71.05, ahead of the European open on Friday. The pair tests 100-day EMA amid bullish MACD, which in turn signal brighter chances of the pair’s recovery.
In doing so, 50% Fibonacci retracement level of September-December fall, at 71.48 will be the immediate choice of buyers during the recovery. However, the pair’s further gains will be restricted by 61.8% Fibonacci retracement around 71.75.
In a case where USD/INR manages to stay positive beyond 71.75, the Bulls can take the reins to cross 72.00 while targeting September 2019 high of 72.63.
Alternatively, pair’s daily closing below 100-day EMA level of 71.10 can push prices further down to 23.6% Fibonacci retracement and 200-day EMA, near 70.86 and 70.72 respectively.
If the bears keep dominating past-70.72, December month bottom near 70.32 and 70.00 round-figure will return to the chart.
USD/INR daily chart

Trend: Pullback expected
