Back


13 Mar 2020
US Dollar Index Price Analysis: DXY on track to record its largest weekly advance since October 2008
- DXY is about to end the New York session near its high tick.
- Support is seen at the 96.00 and 95.00 figures.
DXY daily chart
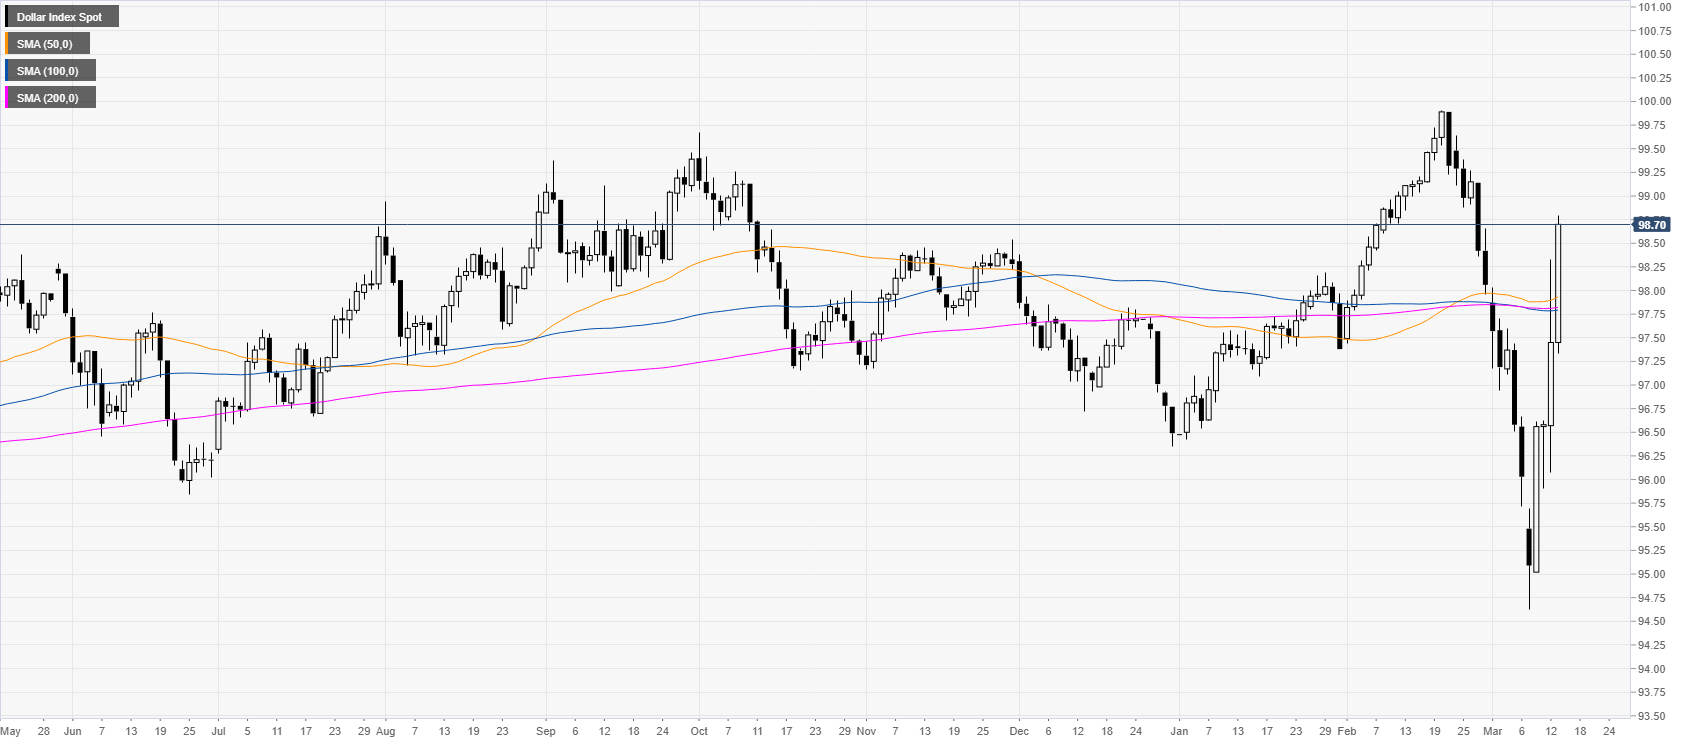
After recording its worst decline in many months DXY (US dollar index) is now on track to register its best weekly gains since October 2008. After one of the worst sessions in history on Thursday, the US stocks are recovering slightly boosting USD across the board.

DXY four-hour chart
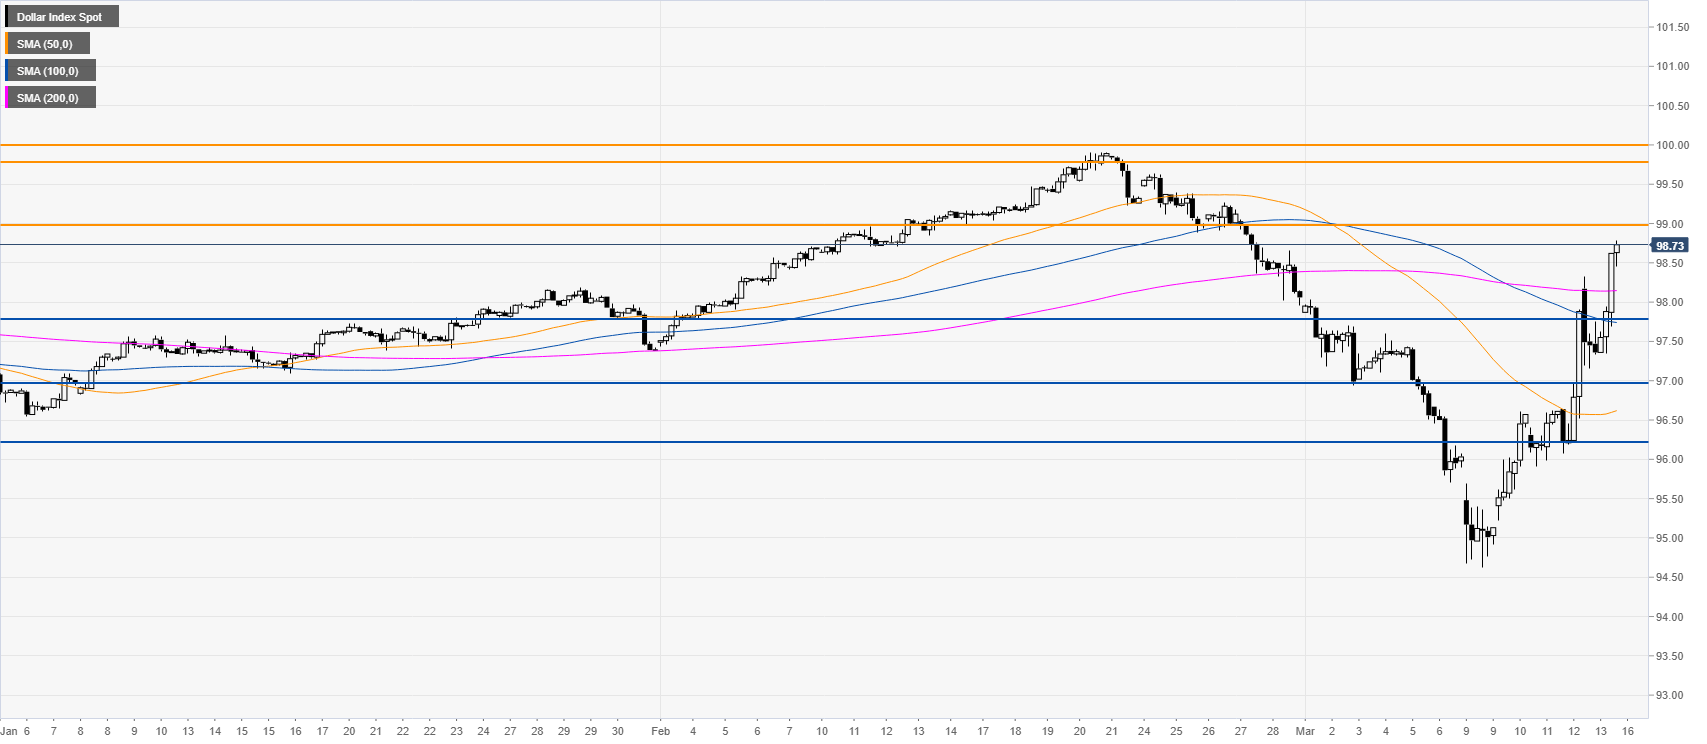
DXY is spiking to the upside while nearing the 99.00 figure while trading above the main SMAs suggesting a bullish bias in the medium term. Given the strength, DXY could reach the 99.75/100.00 resistance zone in the coming sessions. Support is seen near the 97.80 and 97.00 levels.

Additional key levels
