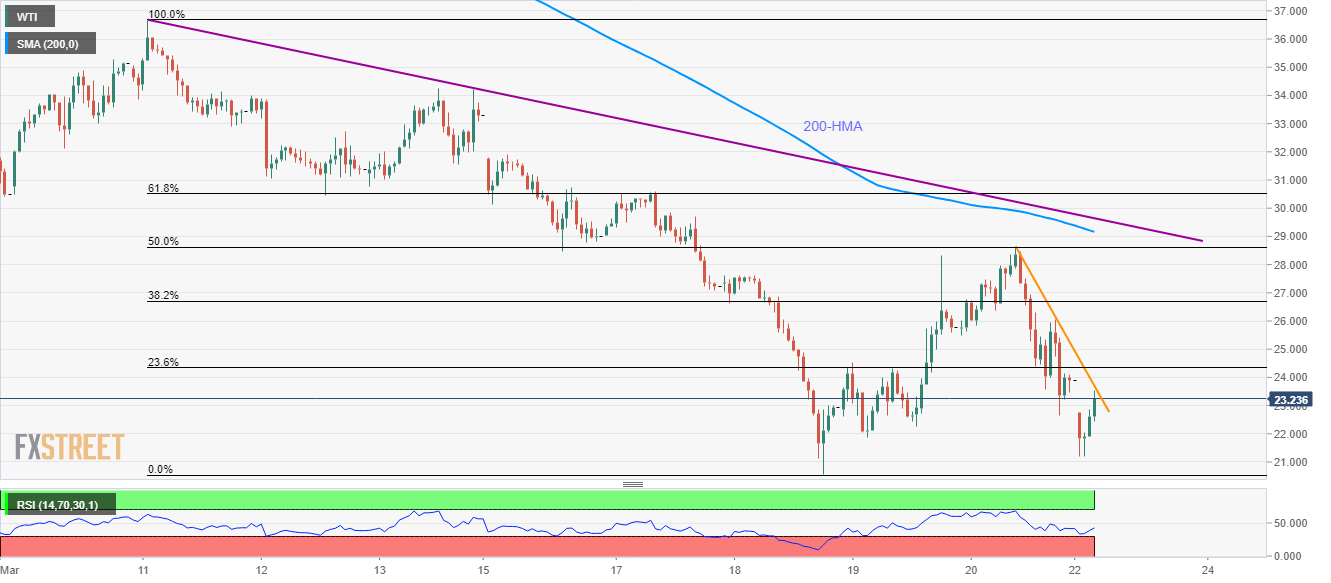
WTI Price Analysis: Bears keep the helm below 61.8% Fibonacci
- WTI remains on the back foot while following the immediate descending trend line since Friday.
- The monthly low, $20.00 are on the bears’ radars.
- 200-HMA, an eight-day-old falling resistance line add to the upside barriers.
Despite bouncing off $21.20 to $23.30, down 2.35%, WTI remains under pressure amid Monday’s Asian session. The oil benchmark currently probes short-term falling trend line while 50% Fibonacci retracement of its March 11-18 declines and 200-HMA, adjacent to a bit broader resistance, limit the near-term upside.
Should the buyers manage to cross the immediate resistance line, currently at $23.70, the black gold can accelerate the recovery moves to 50% Fibonacci retracement level near $28.60.
However, 200-HMA and the aforementioned falling trend line could challenge the buyers around $29.20 and $29.65 respectively.
It should also be noted that the oil price run-up beyond $29.65 needs to overcome a 61.8% Fibonacci retracement level of $30.50 to convince buyers.
Meanwhile, the quote’s downside below $21.20 can aim the monthly low near $20.50 and $20.00 round-figures.
WTI hourly chart

Trend: Bearish
