Back
25 Mar 2020
US Dollar Index Asia Price Forecast: DXY retracement down extends below the101.00 figure
- US dollar index (DXY) is challenging the 50 SMA on the four-hour chart.
- The correction down can extend further however the bull trend remains intact.
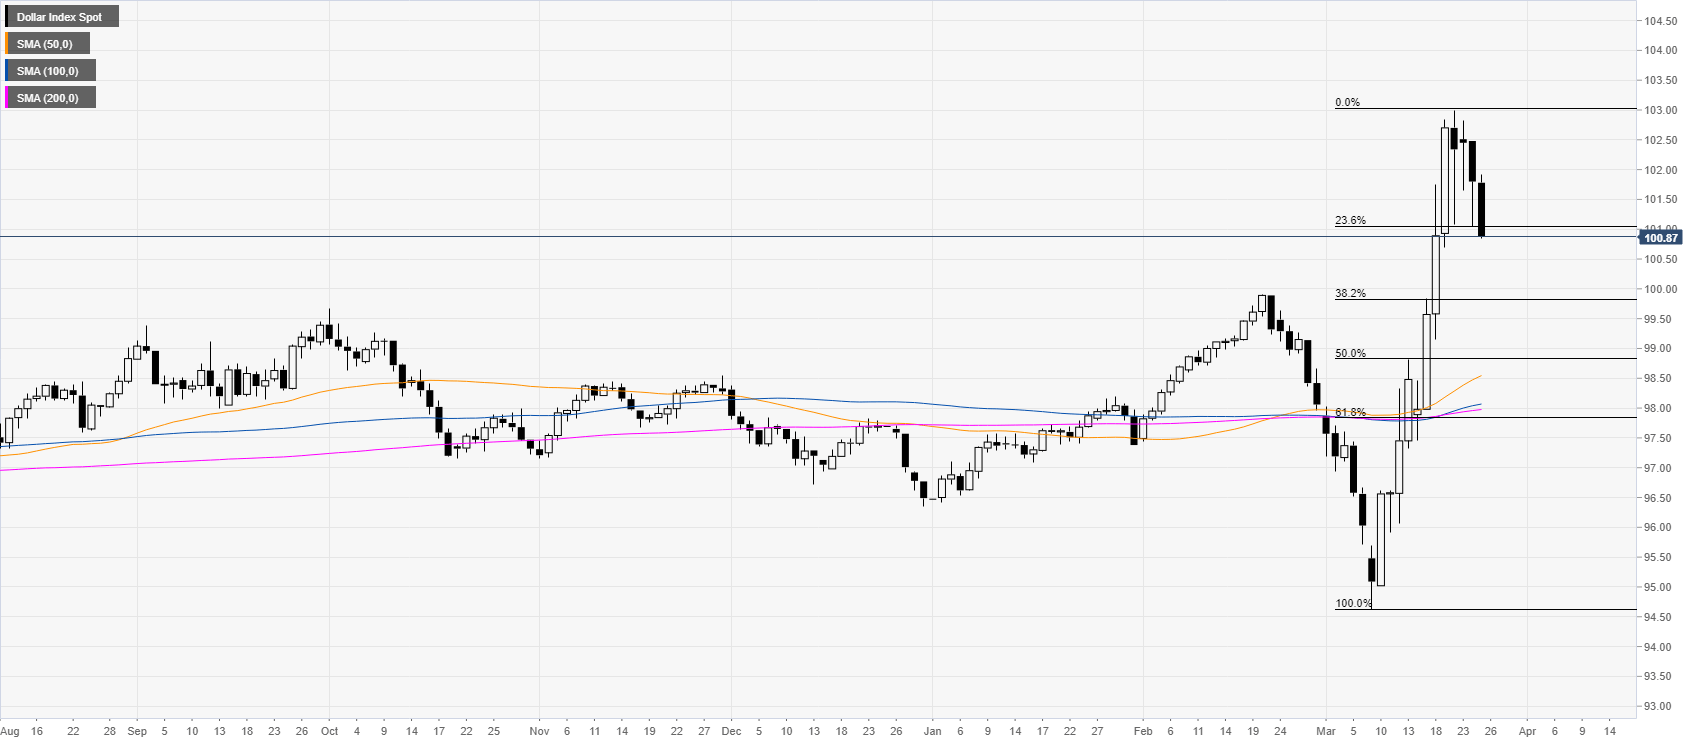
DXY daily chart
DXY is consolidating down for the fourth consecutive day after an above-average spike to the upside. The pullback down exceeded the 23.6% Fibonacci level from the last bullish run.
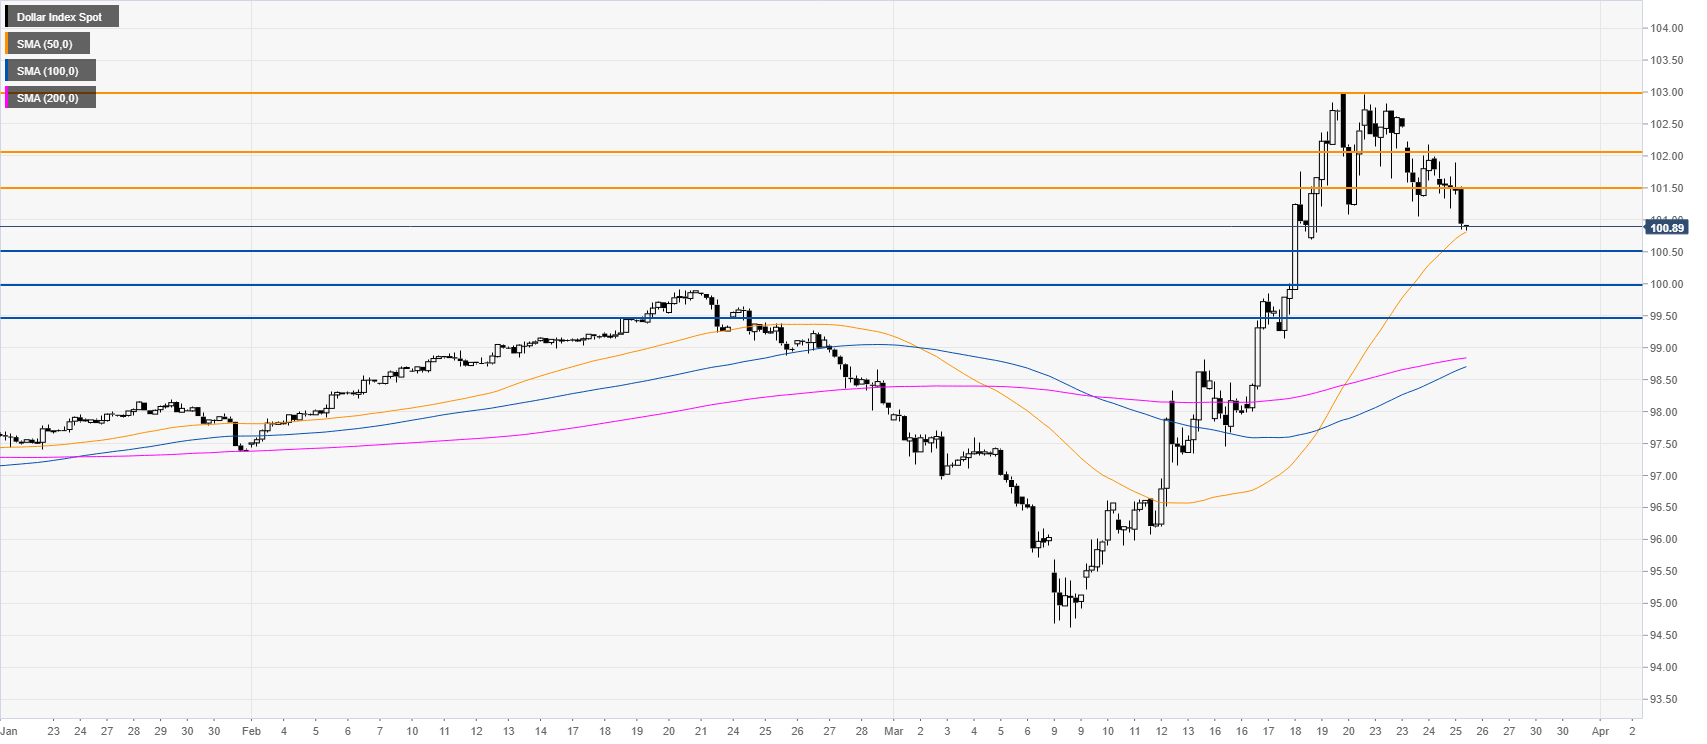
DXY four-hour chart
The greenback is testing the 50 SMA on the four-hour chart as the retracement down is expanding further and could reach the 100.50, 100.00 and potentially the 99.50 level. However, the bull trend should remain intact as buyers would need to recapture the 101.50 level en route to the 102.00 figure for a retest of the 103.00 handle.
Additional key levels