Back
31 Mar 2020
US Dollar Index Price Analysis: DXY bounces and approaches 100.00 handle
- US dollar index (DXY) is up for a second consecutive day.
- The level to beat for buyers is the 100.00 handle.
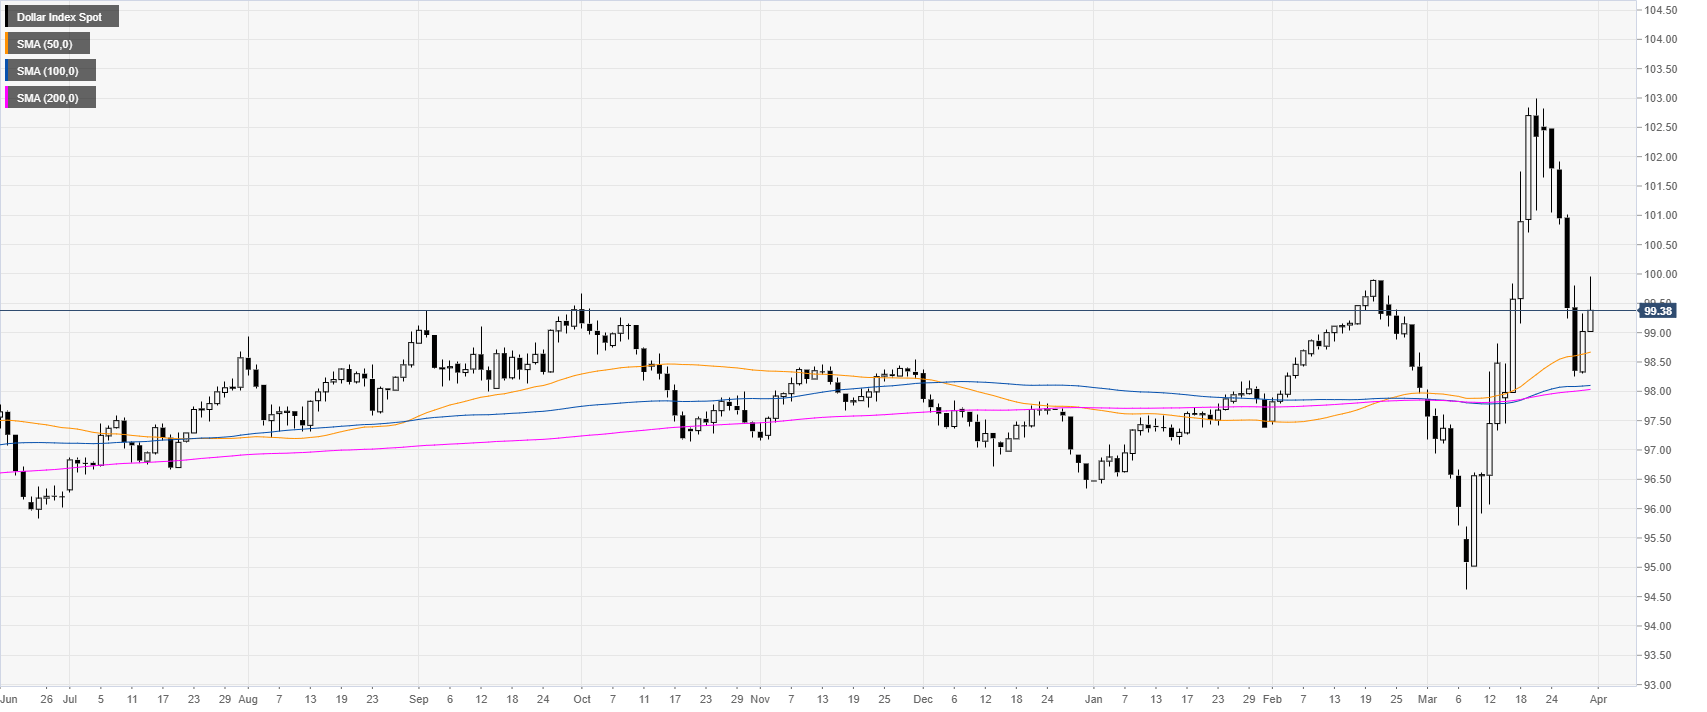
DXY daily chart chart
Last week, the greenback had its largest weekly decline since April 1986 as DXY challenged the 50-day simple moving average on the daily chart.
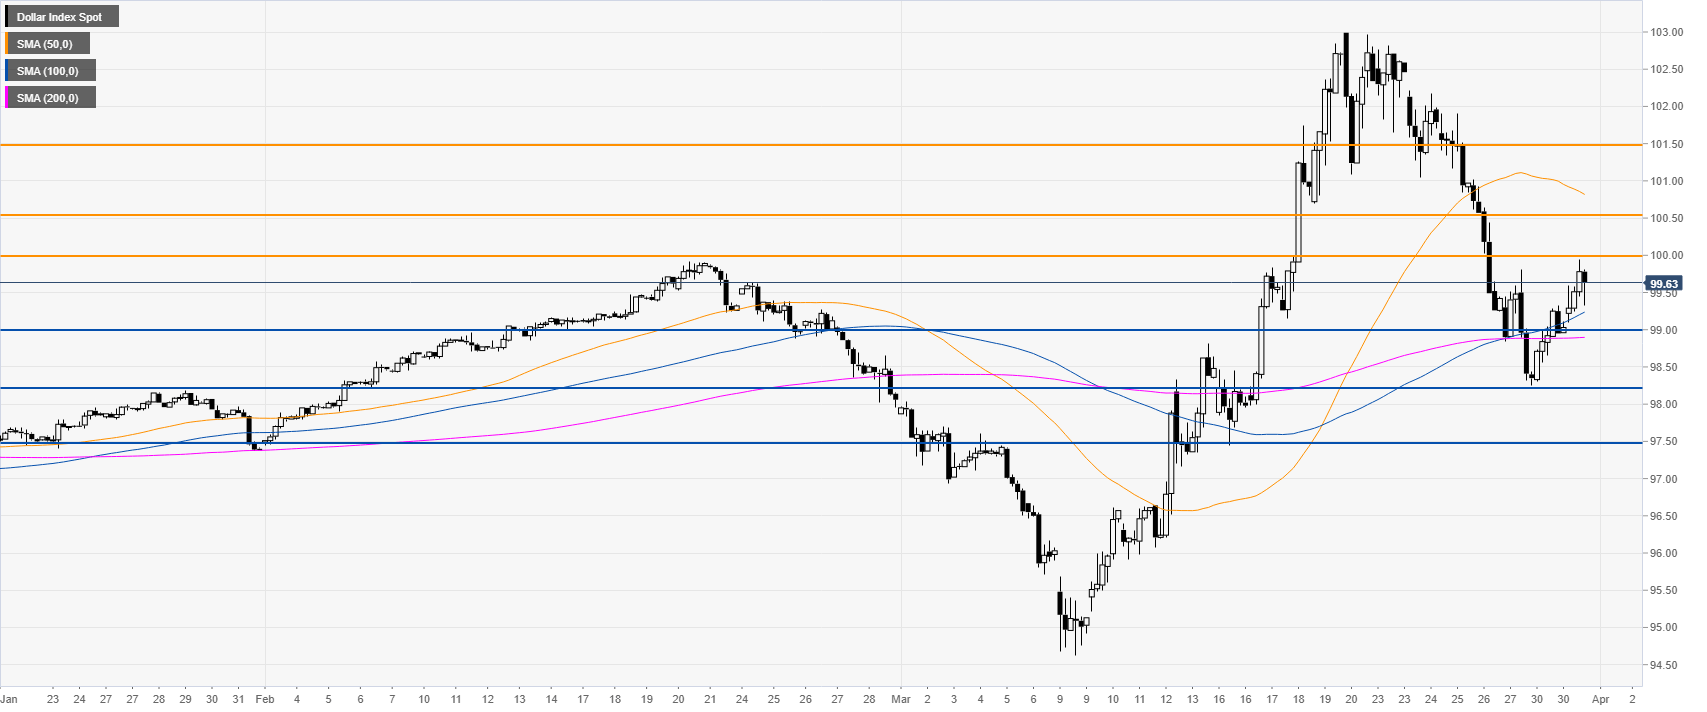
DXY four-hour chart
DXY is rebounding above the main SMAs as the bulls want a daily close above the 100.00 psychological level. A break above the above-mentioned level can open the doors to the 100.50 and 101.50 resistances on the way up. Conversely, bears would need to regain the 98.00 figure to extend the bearish move seen last week.
Additional key levels