Gold Price Analysis: XAU/USD struggles to hold above $1,700
- XAU/USD closed the previous week with small gains at $1,702.
- Near-term outlook suggests that gold is likely to continue to move sideways.
- $1,680 alings as a critical Fibonacci support for the pair.
The troy ounce of the precious metal posted small gains and closed the previous week at $1,702. With the greenback gathering strength and the upbeat market mood in the US session dampening the safe-haven demand, the pair edged lower and was last seen down 0.2% on the day at $1,699.
XAU/USD technical outlook
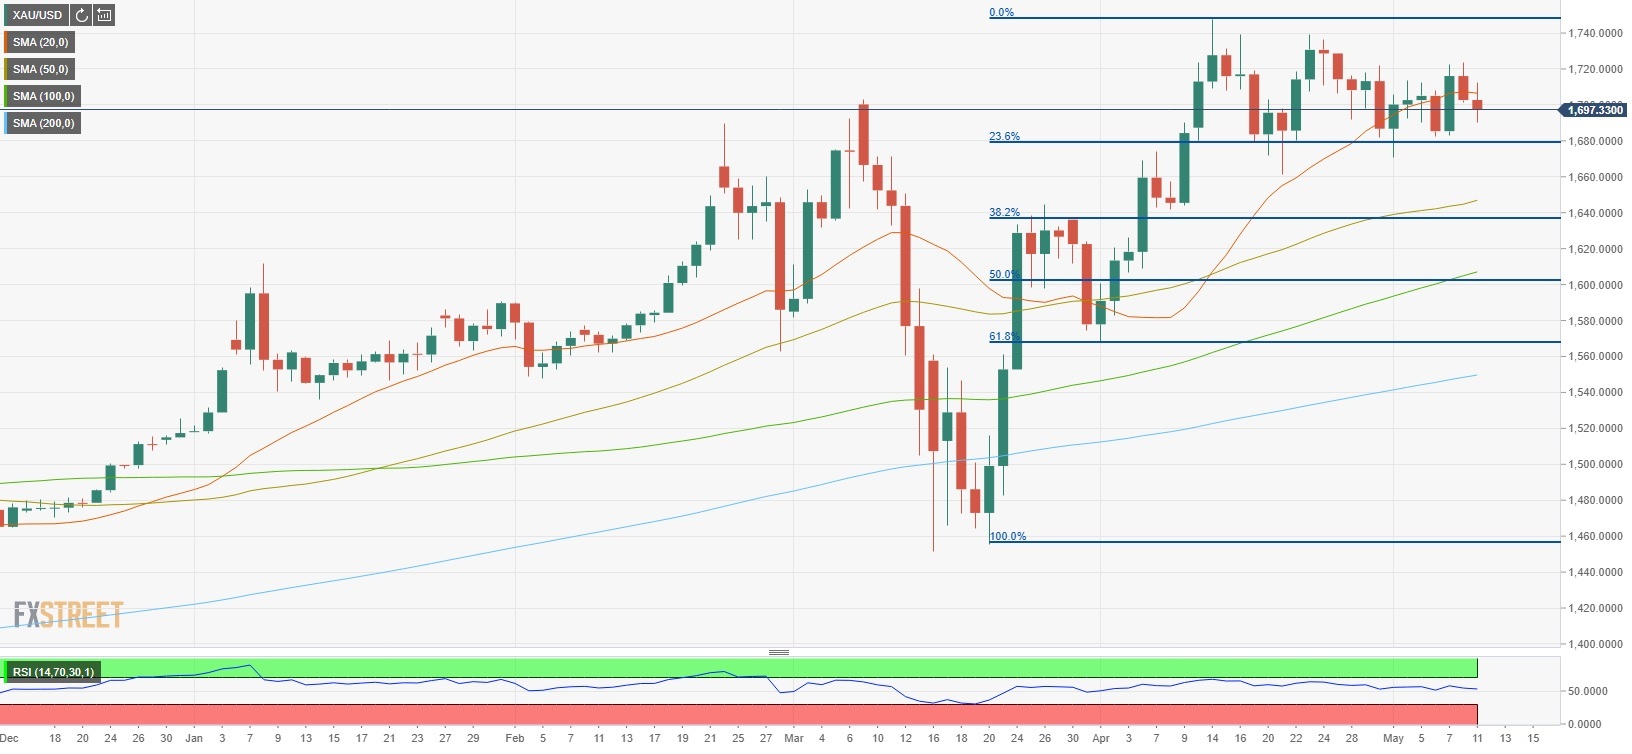
The RSI indicator on the daily chart continues to move sideways near the 50 mark, suggesting that the pair is having a difficult time making a decisive move in either direction in the near-term. However, the pair looks to close the day below the 20-day SMA, which could be taken as a sign that the bearish pressure could build up.
On the downside, $1,680 (Fibonacci 23.6% retracement of Mar. 20 - April 14 rally) is a significant support ahead of $1,660 (Apr. 21 low) and $1,646 (50-day SMA). On the other hand, a daily close above $1,700 could open the door to $1,720 (static resistance) and $1,750 (multi-year highs).
XAU/USD daily chart
Additional technical levels