S&P 500 Futures: Four hurdles may cap the bulls as a new week begins– Confluence Detector
S/P 500 futures have kicked off the week on the back foot amid rising coronavirus cases and uncertainty about a vaccine. How are stocks positioned? Technicals are pointing to more resistance than support.
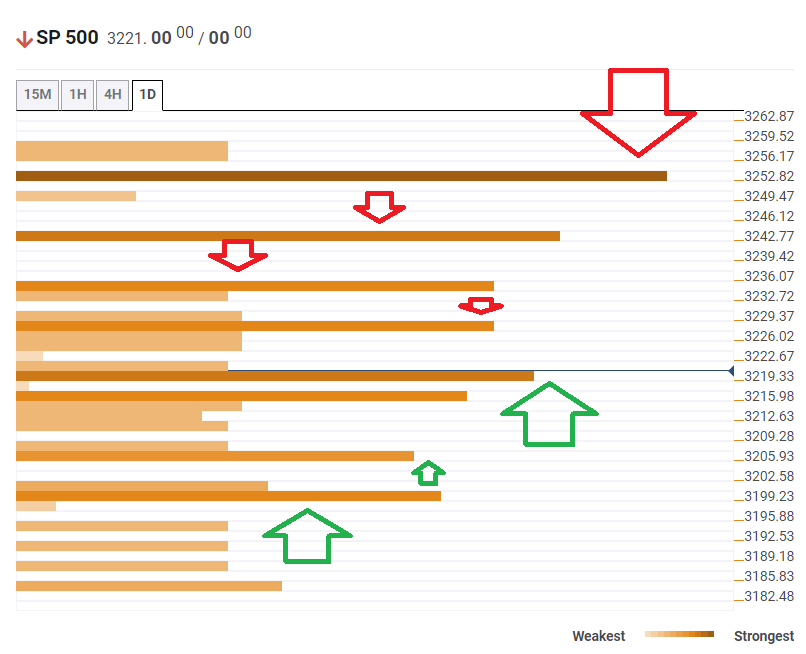
The Technical Confluences Indicator is showing S&P 500 futures face an initial hurdle at 3,228, which is the convergence of the previous daily high and the Bollinger Band 15min-Upper.
It is followed by 3,234, which is where the previous monthly high meets the Pivot Point one-day Resistance 1.
The next cap is more substantial. At 3,242, the confluence of the PP one-day R2 and the previous weekly high awaits S&P 500 futures.
The most significant resistance cluster awaits at 3,252, which is where the previous weekly high and the Bollinger Band 4h-Upper converge.
Immediate support is at 3,219, which is a juncture include the previous 4h-low and the Simple Moving Average 10-1h.
Further down, 3,205 is the confluence of the SMA 50-1h, the SMA 200-15m, and the BB 4h-Middle.
Finally, 3,199 is another cushion, where the BB 1h-Lower and the Fibonacci 38.2% one-week converge.
S&P 500 Chart
Here is how it looks on the tool:
Confluence Detector
The Confluence Detector finds exciting opportunities using Technical Confluences. The TC is a tool to locate and point out those price levels where there is a congestion of indicators, moving averages, Fibonacci levels, Pivot Points, etc. Knowing where these congestion points are located is very useful for the trader, and can be used as a basis for different strategies.
This tool assigns a certain amount of “weight” to each indicator, and this “weight” can influence adjacents price levels. These weightings mean that one price level without any indicator or moving average but under the influence of two “strongly weighted” levels accumulate more resistance than their neighbors. In these cases, the tool signals resistance in apparently empty areas.
Learn more about Technical Confluence