GBP/USD Price Analysis: Bears seeking the next corrective leg to the downside
- GBP/USD is giving mixed structure across the time frames, but the bias is bearish near-term.
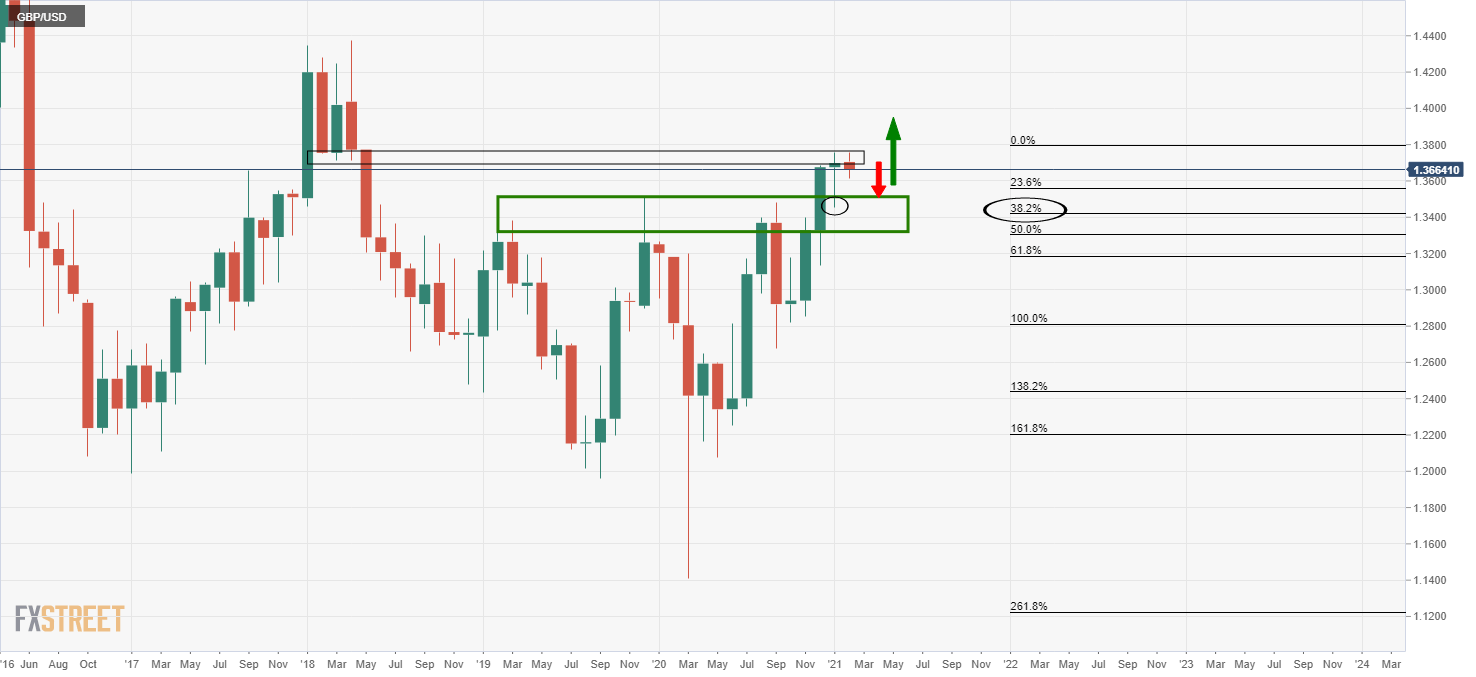
- The monthly rally could be on course for a meaningful correction.
The bears have stepped in and the price is currently testing a critical daily resistance structure as well as a 4-hour time frame resistance level.
The following is a top-down analysis that illustrates where the next trading opportunity could emerge from a 50% mean reversion of the 4-hour bearish impulse.
The price is being resisted and could be headed for a correction to test the prior resistance area.
However, the upside would still be the base case so long as the old resistance holds as new support.
Weekly chart
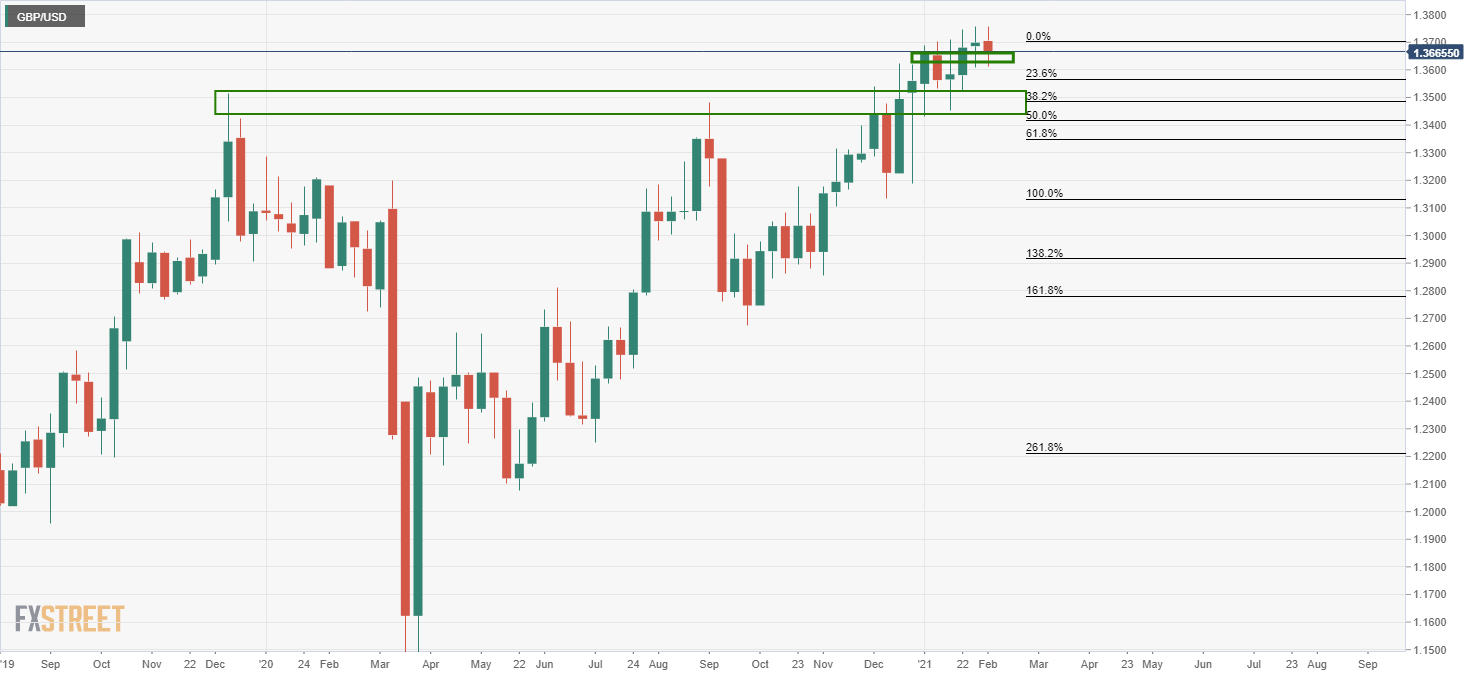
The weekly chart shows that te price is holding above weekly support which is counterintuitive to the monthly outlook.
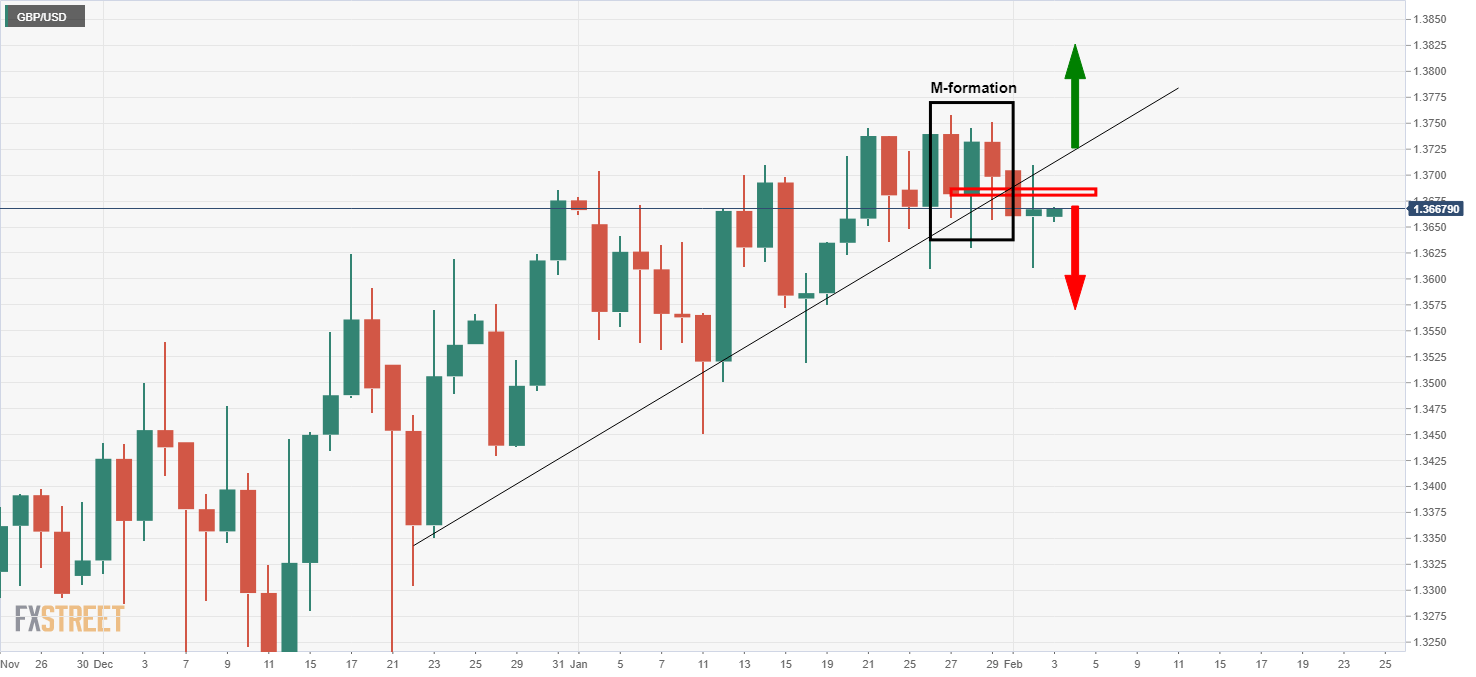
The price has been resisted at the M-formation's neckline while trading below the dynamic trendline support.
Further pressures will likely see the price buck the trend and correlate with the monthly near term outlook and bearish bias.
4-hour chart
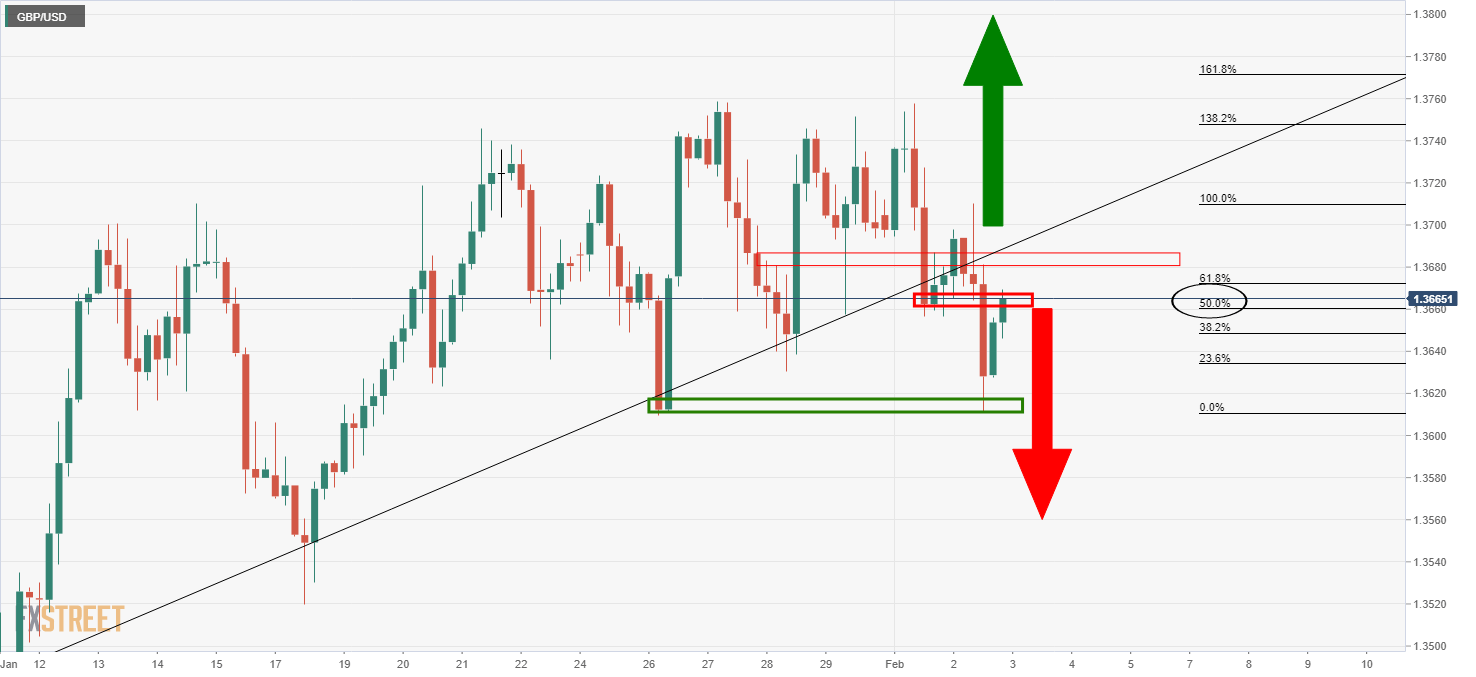
The price has been testing the fresh resistance in recent trade and trigger a move to the downside from this 50% mean reversion.