US Dollar Index Price Analysis: DXY bears flirt with 92.00 inside nearby triangle
- DXY remains indecisive inside a three-day-old symmetrical triangle.
- Trading below 200-SMA keeps sellers hopeful despite recently upbeat Momentum.
- Descending trend lines from late July add to the trading barriers.
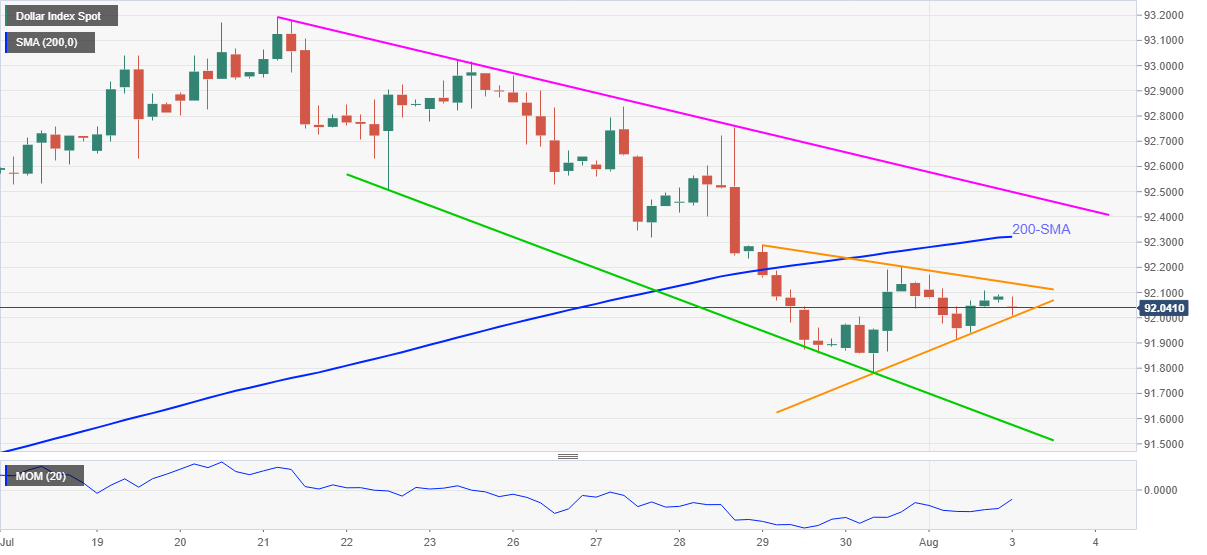
US Dollar Index (DXY) seesaws around 92.00, down 0.06% intraday, amid early Tuesday. In doing so, the greenback gauge remains inside a short-term symmetrical triangle while keeping the previous week’s break of the 200-SMA.
Although an upbeat Momentum line may test intraday sellers around the stated triangle’s support, near the 92.00 threshold, DXY bulls aren’t likely to be convinced until crossing the 200-SMA level of 92.32.
Even so, a downward sloping resistance line from July 21, near 92.50, will be the key hurdle to the north.
It should be noted, however, that an upside break of the triangle’s resistance, near 92.15, could trigger a corrective pullback.
Alternatively, a downside break of the triangle’s support line, close to the 92.00 round figure, will direct US Dollar Index further to the south and highlight an eight-day-old falling trend line, around 91.55, for the DXY sellers.
DXY: Four-hour chart
Trend: Further weakness expected