WTI Price Analysis: On the verge of confirming bearish H&S pattern below $68.00
- WTI remains pressured around weekly low as sellers attack neck-line of head-and-shoulder bearish formation.
- Bearish MACD also favors sellers but 100-SMA adds to the downside filters.
WTI stays on the back foot around $67.70 as traders battle with the key support during early Friday.
The black gold dropped the most in three weeks the previous day and helped portray a head-and-shoulder bearish chart pattern on the four-hour (4H) play.
Given the bearish MACD and downbeat fundamentals, WTI is likely to break the immediate $67.65 support, the same theoretically confirms a fall towards August 19 swing high around $64.00.
However, the 100-SMA level of $67.45 acts as a validation point for the expected downside below $67.65.
Meanwhile, the corrective pullback may aim for $68.00 and $68.80 before targeting the late August high near $69.50 and the latest peak near $69.70.
In a case where the oil buyers manage to cross $69.70, the bearish chart pattern gets negated and the WTI bulls can retake controls to aim for the $70.00 and above.
WTI: Four-hour chart
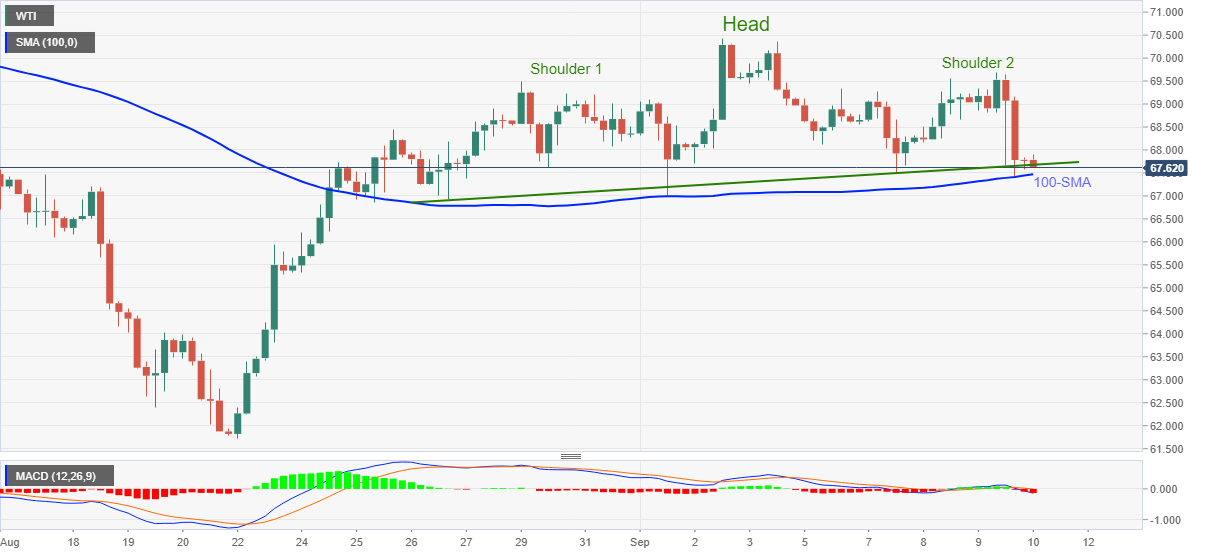
Trend: Further weakness expected