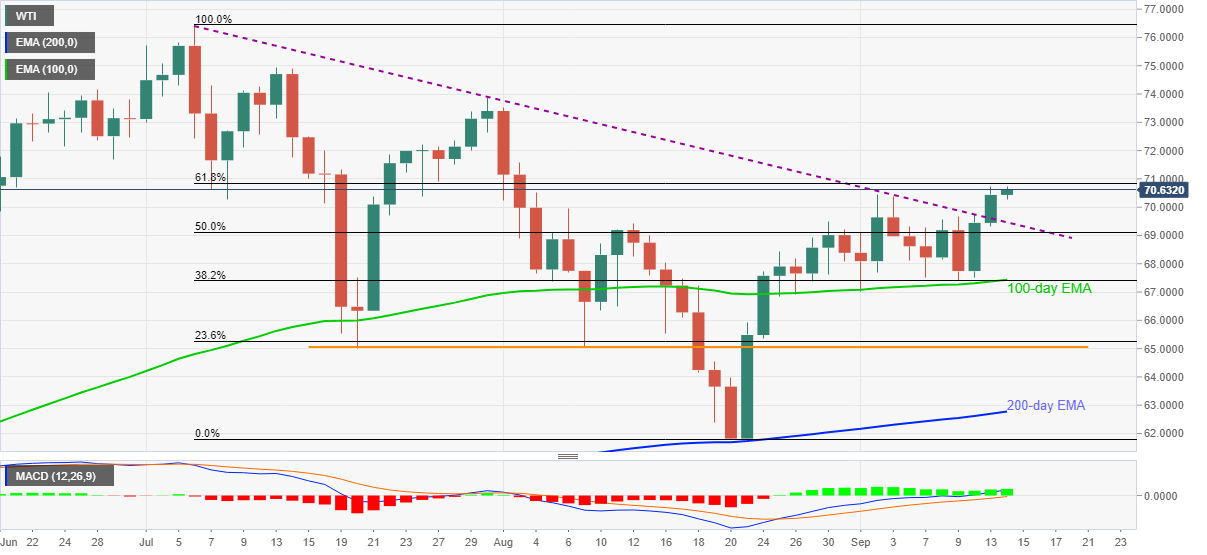
WTI Price Analysis: Prints three-day uptrend on the way to $71.00
- WTI stays firmer around six-week high, picks up bids of late.
- Bullish MACD, sustained rebound from 100-day EMA, upside break of multi-day-old resistance line favor buyers.
- 61.8% Fibonacci retracement of July-August fall guards immediate upside.
WTI takes the bids around $70.65, up 0.30% intraday during early Tuesday. In doing so, the black gold rises for the third consecutive day after refreshing the highest levels since early August the previous day.
Given the bullish MACD signals and the quote’s ability to keep recovery moves from 100-day EMA, not to forget breaking a downward sloping resistance line from July 03, WTI stays directed towards the 61.8% Fibonacci retracement (Fibo) level surrounding $70.85.
Following that, the $71.00 threshold will act as a validation point before fueling the energy prices towards the late July tops near $73.90.
Meanwhile, the resistance-turned-support near $69.45 acts as an immediate catalyst to trigger the profit-booking moves if broken.
Even so, WTI bears will remain skeptical unless witnessing a clear downside break of $67.40 comprising 100-day EMA and 38.2% Fibo.
In a case where the commodity prices remain pressured towards the south following the $67.40 breakdown, a two-month-old horizontal area around $65.00 will be in focus.
WTI: Daily chart

Trend: Further upside expected
