GBP/USD Price Analysis: Bulls need validation from 100-SMA
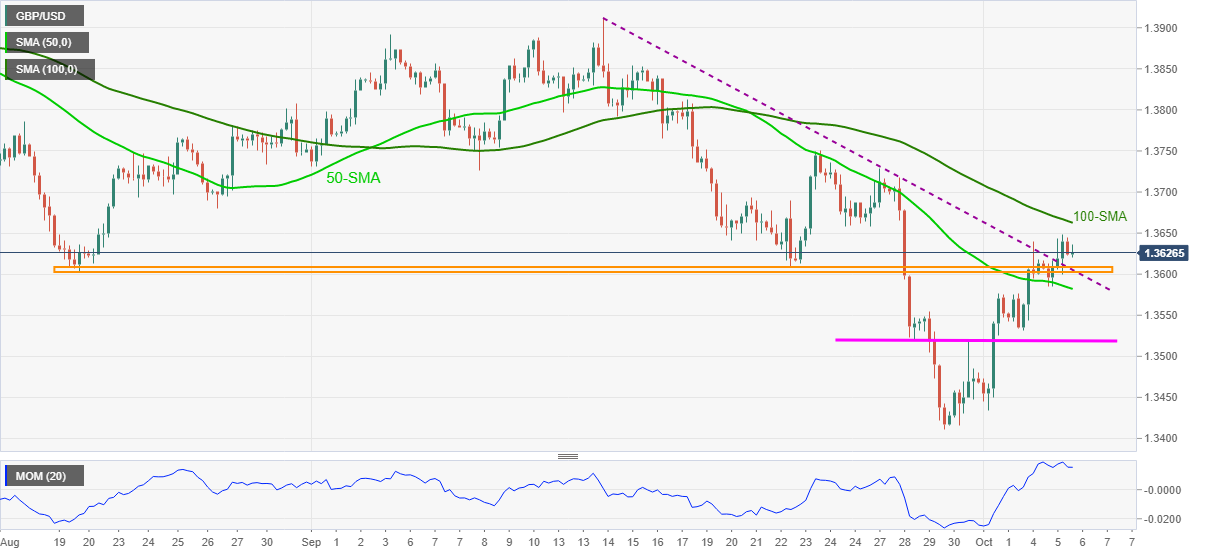
- GBP/USD grinds higher after crossing six-week-old horizontal area, descending trend line from mid-September.
- Momentum line hints at a pullback below the key SMA hurdle.
- Sellers will wait for a 50-SMA breakdown for fresh entries.
GBP/USD struggles to keep the latest rebound above 1.3600, recently easing to 1.3625 during Wednesday’s Asian session.
The cable pair crossed the key 1.3600-3610 resistance area, now support, the previous day but the 100-SMA challenges the upside moves. The Momentum indicator also hints at the bull’s tiredness.
Even so, the pullback remains elusive unless breaking the 50-SMA level of 1.3582, not to forget the convergence of a horizontal area from August 20 and a three-week-old descending trend line near 1.3610-3600.
In a case where the GBP/USD sellers retake controls, a one-week-long horizontal line around 1.3520 will probe the downturn targeting the yearly low marked in September around 1.3415.
Alternatively, an upside clearance of the 100-SMA, close to 1.3665 by the press time, will aim for late September’s swing high near 1.3750 before directing the GBP/USD bulls to the last month’s peak of 1.3913.
Overall, GBP/USD bulls should wait for a confirmation of the latest price-positive signal.
GBP/USD: Four-hour chart
Trend: Pullback expected