WTI Price Analysis: Recovery remains elusive below $80.00
- WTI keeps rebound from six-week low, sidelined of late.
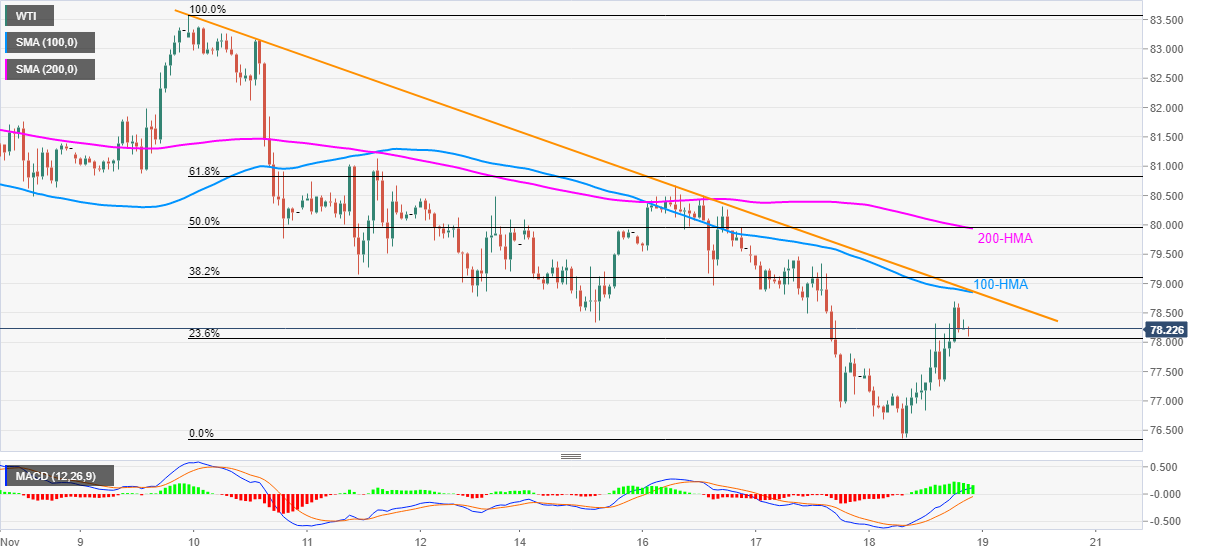
- 100-HMA, weekly resistance line guards immediate upside, 200-HMA, 50% Fibonacci retracement also challenge the bulls.
- July’s peak, bullish MACD signals restrict immediate downside.
WTI holds onto the strongest daily performance in over a week, not to forget the bounce off 1.5-month low during early Friday morning in Asia. That said, the black gold seesaws around $78.25-20 by the press time.
While July’s top put a carpet under the commodity’s downturn and MACD signals helped buyers to return, strong resistance levels do challenge the quote to defy the four-week downtrend.
Among the key hurdles, the first one comprises the 100-HMA and a descending trend line from November 09, near $78.90. Following that, a convergence of the 200-HMA and 50% Fibonacci retracement (Fibo.) of November 09-18 fall, close to the $80.00 threshold, will be a tough nut to crack for the WTI bulls.
In a case where the energy benchmark rises past $80.00, the weekly top near $80.70 and November 11 peak of $81.13 will be in focus.
Alternatively, pullback moves need to conquer the July month’s top of $76.40 to convince WTI crude oil sellers and aim for the 100-DMA level near $73.90.
Overall, WTI bears seem to have run out of steam but the bulls aren’t fully ready.
WTI: Hourly chart
Trend: Further recovery expected