GBP/USD Price Analysis: Prints bullish flag on 1H around monthly top
- GBP/USD prints mild intraday losses inside bullish chart pattern.
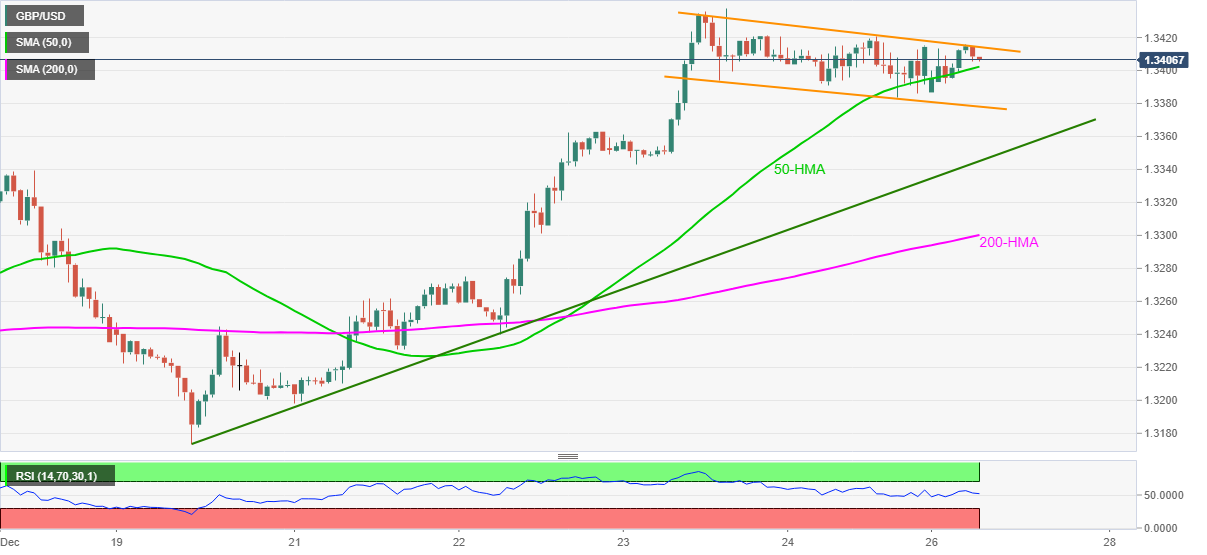
- Successful trading above key HMAs, weekly support line keeps buyers hopeful.
- Confirmation of bulls flag exposes buyers towards November’s high.
GBP/USD retreats to 1.3405, down 0.07% intraday, during early Monday morning in Europe.
Even so, the cable pair stays inside a bull flag while keeping the previous day’s bounce off 50-HMA. Adding to the bullish bias is the weekly ascending trend line, rising 200-HMA and steady RSI.
However, a clear upside break of the flag’s resistance, around 1.3615 by the press time, will be important for the GBP/USD bulls to prosper.
Although the bullish flag confirmation hints at a theoretical target of 1.3665-70, tops marked during November 18 and 09, respectively around 1.3515 and 1.3610, can act as intermediate halts during the expected rise.
Meanwhile, the 50-HMA level near 1.3400 precedes the stated flag’s support line close to 1.3375 to restrict short-term GBP/USD declines.
In a case where the GBP/USD prices drop below 1.3375, an upward sloping support line from December 20 and 200-HMA, around 1.3345 and 1.3300 in that order, will be crucial to watch for clear direction.
GBP/USD: Hourly chart
Trend: Further upside expected