US Dollar Index Price Analysis: 12-day-old support defends DXY bulls
- DXY licks its wounds after biggest daily fall in a month.
- Short-term ascending trend line tests sellers ahead of the key SMA.
- Upbeat Momentum line, sustained trading beyond short-term important supports favor buyers.
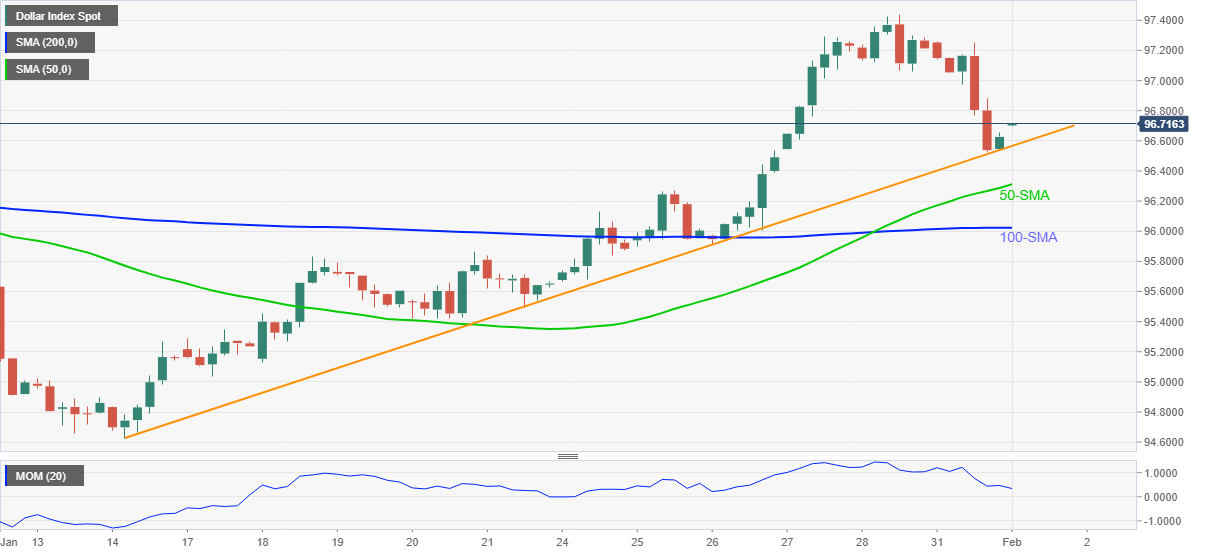
US Dollar Index (DXY) picks up bids to 96.70 while consolidating the heaviest daily fall in a month during Tuesday’s Asian session.
In doing so, the greenback gauge bounces off an upward sloping support line from January 14, near 96.55.
Given the halt in the descending Momentum line around important support, DXY bulls stay hopeful until the quote remains above 96.55.
Following that, 50-SMA and 100-SMA, respectively around 96.30 and 96.00, will challenge the DXY bears before giving them controls to aim for the mid-January peak of 95.83.
On the flip side, the 97.00 threshold will restrict the quote’s immediate upside ahead of directing them to the recently flashed multi-month high of 97.44.
Should the US Dollar Index remains firmer past 97.44, the 98.00 round figure may test the bulls before directing them to the early 2020 low near 98.30. It’s worth observing that the June 2020 peak surrounding 97.80 may offer an additional hurdle to the north.
DXY: Four-hour chart
Trend: Further upside expected