USD/JPY Price Analysis: Bounces off 21-day EMA towards 115.00
- USD/JPY stays firmer around intraday top, snaps two-day downtrend to recovery from weekly low.
- Steady RSI, oversold Momentum line back further recovery.
- 10-week-old horizontal area becomes a key hurdle, 100-day EMA adds to the downside filters.
USD/JPY consolidates weekly losses around 114.80 amid the late Asian session on Wednesday.
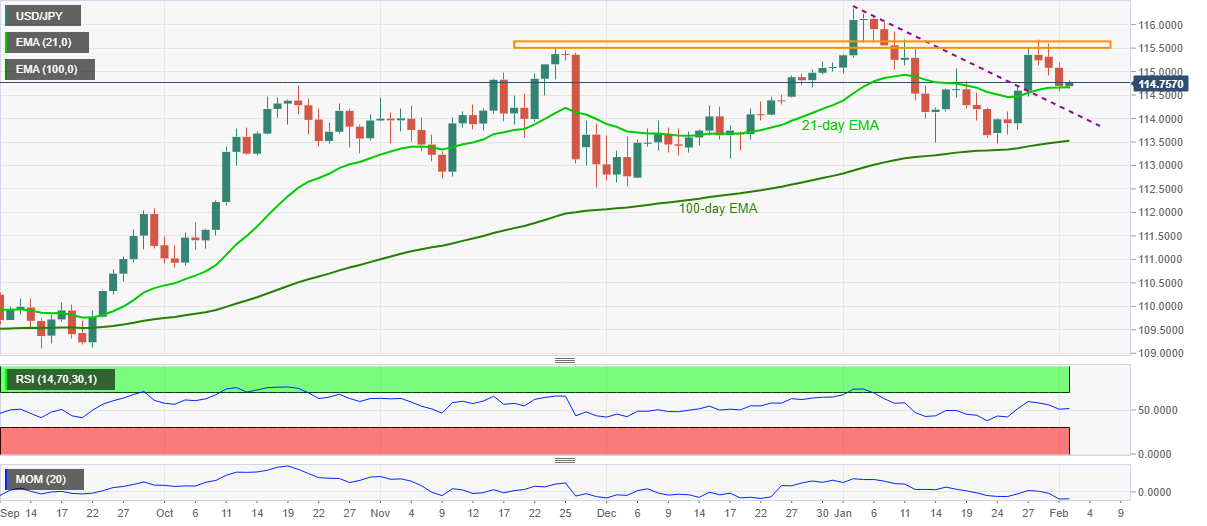
The yen pair bounces off 21-day EMA as sellers ran out of steam around weekly low, as per the Momentum line.
The rebound takes clues from steady RSI to suggest further advances towards the 115.00 threshold.
However, a horizontal area comprising multiple levels marked since November 24, near 115.50-60, becomes a tough nut to crack for USD/JPY bulls, a break of which will enable them to aim for the yearly high around 116.35.
Alternatively, pullback moves will need to provide a daily closing below the 21-day EMA level of 114.65 to convince sellers.
Even so, the previous resistance line from January 04 and the 100-day EMA, respectively around 114.15 and 113.50, will challenge the USD/JPY bears afterward.
USD/JPY: Daily chart
Trend: Further recovery expected