USD/TRY Price Analysis: Bulls jostle with monthly resistance near $13.60
- USD/TRY grinds higher around intraday top, battles monthly resistance line.
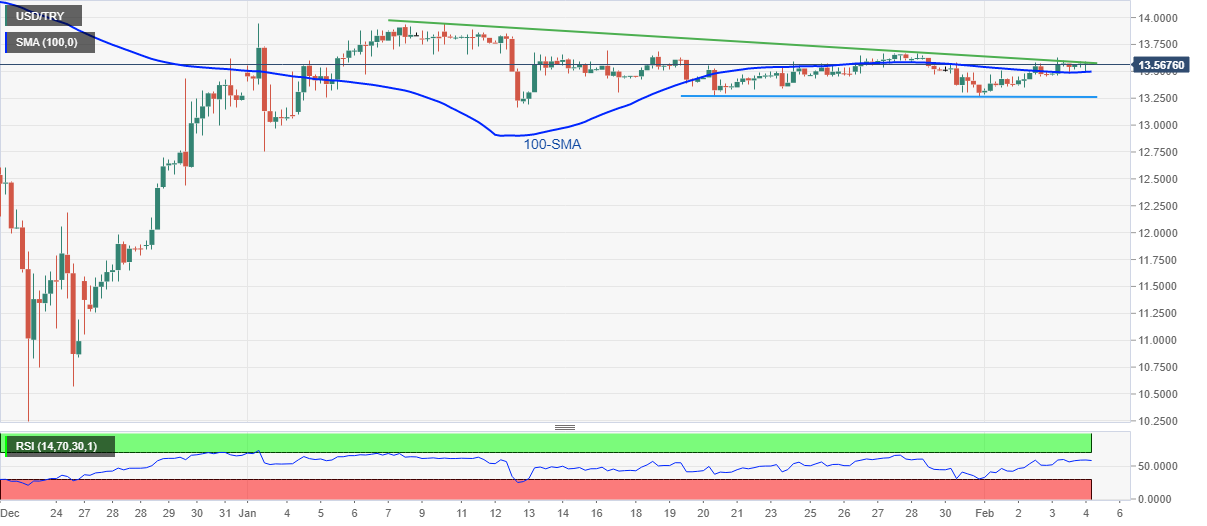
- Sustained trading beyond 100-SMA, gradually rising RSI favor buyers.
- Sellers need validation from two-week-old horizontal support for the ruling.
USD/TRY seesaws around monthly resistance line, close to $13.55-60 heading into Friday’s European session.
That said, the Turkish lira (TRY) pair’s successful trading above the 100-SMA joins a gradually rising RSI line to suggest that buyers’ slow run towards the victory.
However, a clear upside break of $13.60 becomes necessary for them to challenge January’s peak surrounding $13.94.
Should the USD/TRY prices rally beyond $13.94, the $14.00 and December 21 peak of $14.14 will be in focus.
Alternatively, pullback moves may initially aim for the 100-SMA level of $13.49, a break of which will direct the quote towards the short-term horizontal support near $13.25.
During the USD/TRY weakness past $13.25, the January 12 low near $13.16 may offer an intermediate halt to the south-run targeting the $13.00 threshold.
USD/TRY: Four-hour chart
Trend: Further recovery expected