US Dollar Index Price Analysis: DXY struggles to defend 100-SMA breakout
- DXY grinds higher past key moving averages, stays below three-week-old resistance area.
- Firmer RSI keeps buyers hopeful to overcome immediate hurdle, monthly support line adds to the downside filters.
US Dollar Index (DXY) bulls flirt with the 96.00 threshold during an inactive Asian session on Monday.
The greenback gauge rose during the last two days to poke the highest levels since February 03 the previous day.
The upside momentum also gains support from the sustained break of 200-SMA and 100-SMA.
Given the firmer RSI adding to the bullish bias, the DXY is up for challenging a horizontal area established since January 25, near 96.30.
Following that, the upward trajectory will aim for the 97.00 threshold before January’s top of 97.44.
Meanwhile, pullback moves may initially battle the 100-SMA level of 96.00 before testing the 200-SMA level surrounding 95.85.
Even if the quote drops below 95.85 support, an upward sloping trend line from January 14, near 95.35 at the latest, will challenge the US Dollar Index bears.
DXY: Four-hour chart
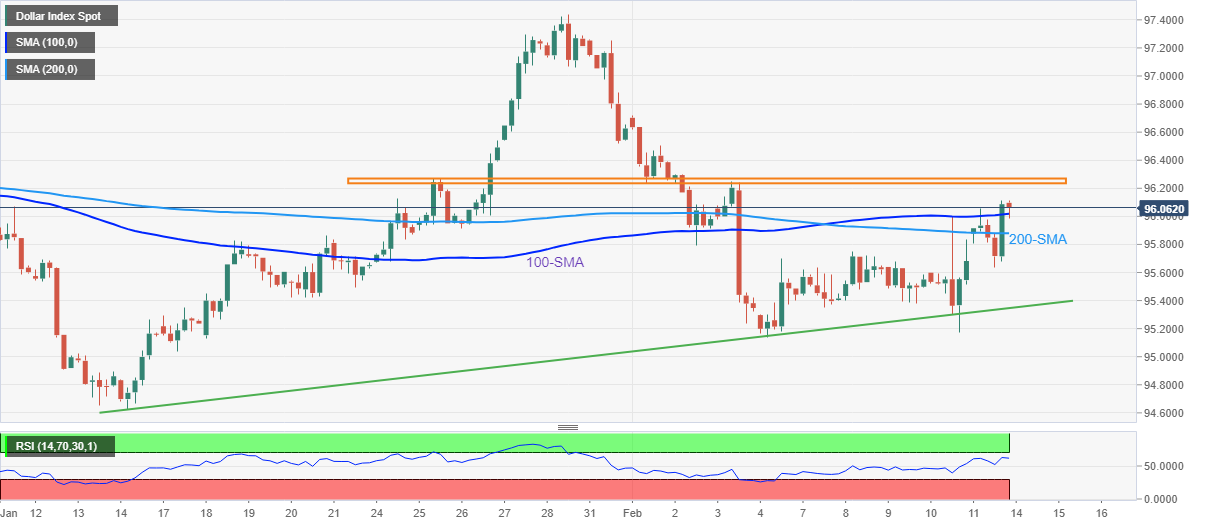
Trend: Further upside expected