NZD/USD Price Analysis: Weekly support and M-formation could see the bulls back in control
- NZD/USD bears running into a wall of support.
- The weekly M-formation is a compelling feature on the charts.
NZD/USD has been in supply of late, as the following weekly analysis illustrates, beaten down amid a general deterioration in global risk appetite as US bond yields rose. April has been a pood month for the bird, dropping its lowest level since mid-2020 and right on key support.
''How it fares this week will likely be influenced not just by broad global risk appetite, but also Thursday’s Fed decision and NZ labour market data on Wednesday,'' analysts at ANZ Bank said. In the meantime, there is scope for a bullish correction if the bulls can fend off the bears at a critical weekly support structure.
NZD/USD weekly chart
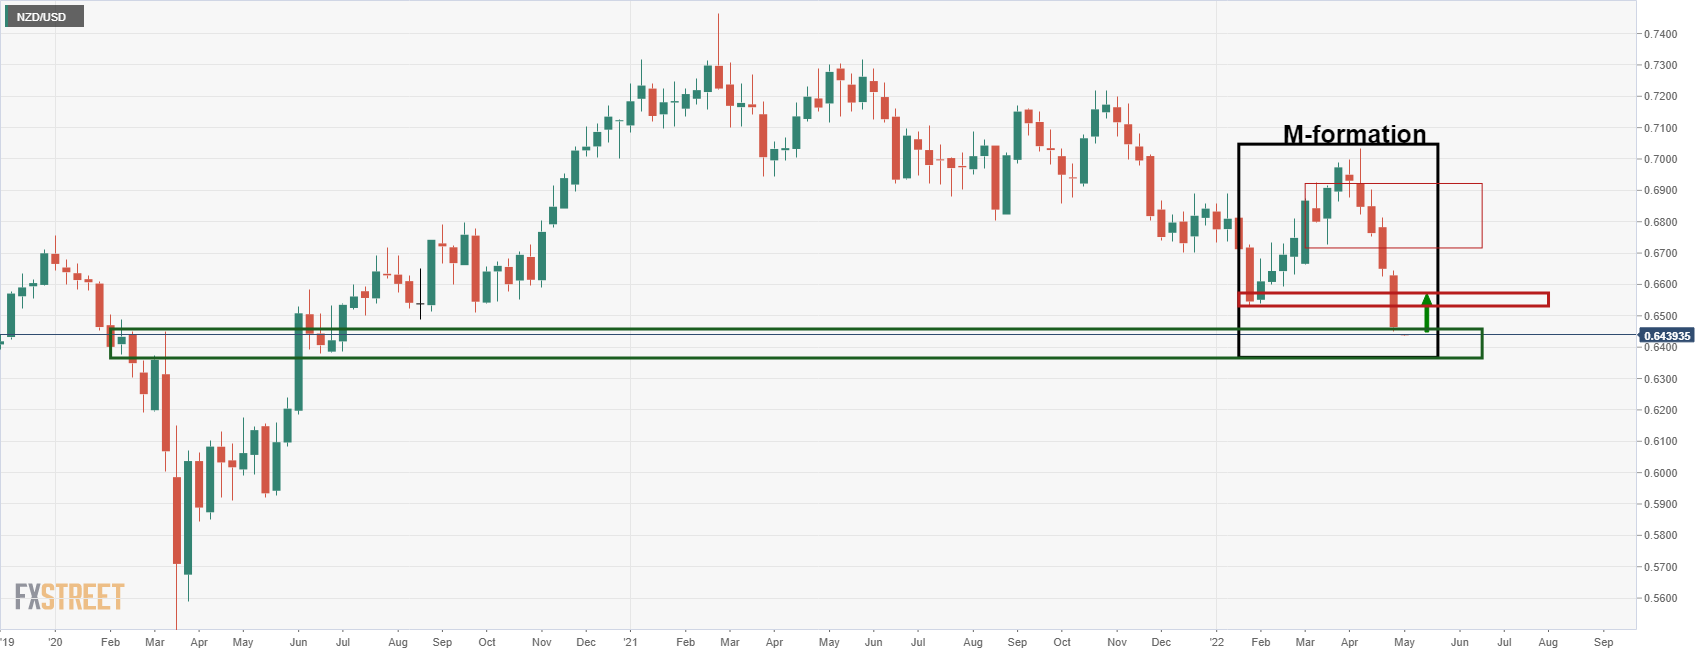
NZD/USD's weekly chart sees the price running into a long-term structure area and the focus is on the prior low near 0.6530. Above there, the bulls will be looking to the next line of the M-formation near 0.68 the figure.