US Dollar Index Price Analysis: Rising wedge tease DXY bears near 102.50
- US Dollar Index struggles to extend latest recovery inside a bearish chart pattern.
- Bearish RSI divergence, pullbacks from 200-SMA also keep sellers hopeful.
- Bulls need validation from 103.00, downside break of 102.00 confirms rising wedge.
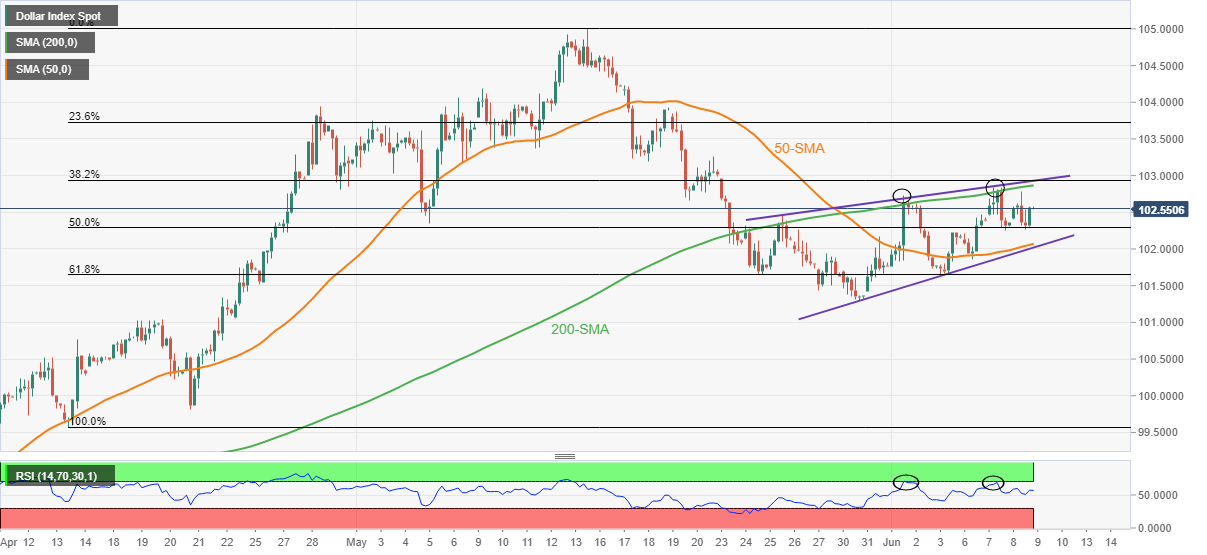
US Dollar Index (DXY) fades upside momentum inside a rising wedge bearish formation during Thursday’s Asian session. In doing so, the greenback gauge dribbles around 102.55, following the previous day’s bounce off the 50% Fibonacci retracement (Fibo.) of April-May upside.
In addition to the rising wedge, the quote’s multiple failures to cross the 200-SMA since late May joins the bearish RSI divergence to tease the sellers. It’s worth noting that the higher high in prices contrasts with the lower high in RSI (14) to portray the bearish divergence.
That said, the quote’s pullback moves remain elusive until it stays beyond the 50% Fibonacci retracement level of 102.30.
Also acting as the key downside hurdle is the confluence of the 50-SMA and the stated wedge’s support line, close to 102.00.
In a case where the US Dollar Index drops below 102.00, the odds of its south-run to May’s bottom surrounding 101.30 can’t be ruled out.
Alternatively, the 200-SMA and the wedge’s resistance line challenge recovery moves around 102.85.
Following that, the 103.00 threshold appears to challenge the DXY bulls before directing them towards April’s peak of 103.94.
DXY: Four-hour chart
Trend: Pullback expected