AUD/NZD Price Analysis: Stays on the way to 1.1255-60 key hurdle
- AUD/NZD defends the previous day’s bounce off 21-SMA, picks up bids of late.
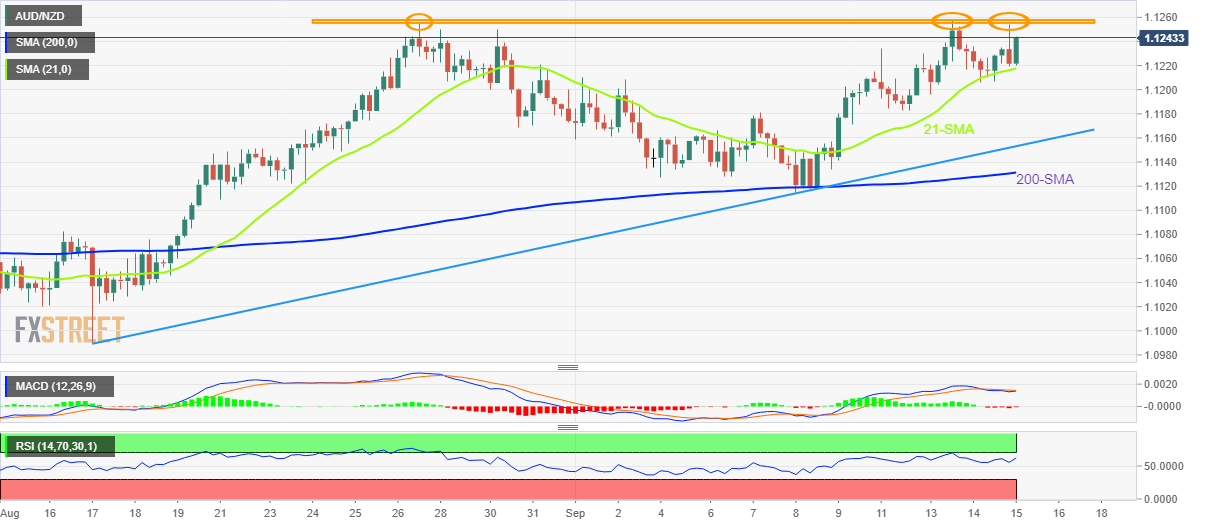
- Firmer RSI, sustained trading beyond the key SMA, trend lines favor buyers.
- Triple tops around 1.1255-60 appear tough nuts to crack for bulls.
- Bears need validation from 200-SMA, monthly support line.
AUD/NZD picks up bids to reverse the early Asian session losses near 1.1240 on Thursday. The cross-currency pair’s latest moves ignore the mixed Aussie data, as well as strong New Zealand GDP numbers, while directing buyers towards the three-week-old horizontal hurdle.
Australia’s Employment Change rose to 33.5K, versus 35K expected and -40.9K prior during August. Further, the Unemployment Rate also rose beyond 3.4% market consensus and the previous readings to 3.5% whereas the Participation Rate matched 66.6% forecasts versus 66.4% prior. Earlier in the day, Australia’s Consumer Inflation Expectations softened to 5.4% for September versus 6.7% expected and 5.9% prior.
Earlier in the day, New Zealand’s (NZ) second quarter (Q2) Gross Domestic Product (GDP) grew 1.7% QoQ compared to 1.0% market expectations and a prior contraction of 0.2%, per the latest report from Statistics New Zealand. The YoY figures came in as 0.4% versus 0.2% expected and 1.2% previous readouts.
That said, the upward sloping RSI (14) joins the AUD/NZD pair’s successful rebound from the 21-SMA, and teases another battle with the all-important 1.1255-60 horizontal resistance area. Following that, tops marked during October 2017 around 1.1290 could test the bulls.
Meanwhile, pullback moves need a clear downside break of the 21-SMA support, near 1.1215 by the press time, to convince sellers.
Even so, an upward sloping support line from August 17 and the 200-SMA, respectively near 1.1150 and 1.1130, could challenge the AUD/NZD bears.
AUD/NZD: Four-hour chart
Trend: Further upside expected